Tuesday 10 January 2023

USDINR makes a bearish reversal candlestick pattern

USDINR pair made a bearish reversal candlestick pattern on two monthly candles while the EURUSD pair made a bearish reversal pattern two months back.


For more charts and continued guidance, the author can be contacted at: riskadvisory@outlook.com.

DISCLAIMER:

These extracts from my trading worksheets/ workbooks are for the purpose of education only. Any advice contained therein is provided for the general information of readers and does not have regard to any particular person's or institution’s investment objectives, financial situation or needs and must not be construed as an advice to buy, sell, hold or otherwise deal/ trade in any single or set of commodities, currencies, indices, securities or other investments of any other form(s). Accordingly, no reader should act on the basis of any information contained therein without consulting a suitably qualified financial advisor in the first place.

Friday 31 December 2021

US Dollar may have precipitous fall against Euro and other currencies

 Starting Jan 2022, the US Dollar may have precipitous fall against EUR and other currencies.


Best wishes for the festive season and a Covid-free prosperous 2022.

For more charts and continued guidance, the author can be contacted at: riskadvisory@outlook.com

Disclaimer:

These extracts from my trading worksheets/books are for the purpose of education only. Any advice contained therein is provided for the general information of readers and does not have regard to any particular person's or institution’s investment objectives, financial situation or needs and must not be construed as an advice to buy, sell, hold or otherwise deal/ trade in any single or set of commodities, currencies, indices, securities or other investments of any other form(s). Accordingly, no reader should act on the basis of any information contained therein without consulting a suitably qualified financial advisor in the first place.


Sunday 31 May 2020

Weak US Dollar may give temporary buoyance to the Global Financial markets

On 16th-17th March, this calendar year, all financial markets - stocks, commodities, bonds, bullion, made lows of the recent past - in many cases lows of at least a decade - due to the scare of pandemic spread by Corona virus. With the G-7 nations committed to providing stimulus within the capacity of their respective economies, many of them have injected liquidity in the form of physical cash, reduction of interest rates, deferment of taxes, etc. Federal Reserve held two unscheduled meetings in March to announce various stimulus measures.

The mayhem in the financial markets normally occurs on account of reduced liquidity and lack of commitment on part of the members to buy. Forced selling in one segment leads to high volatility in that particular segment/ market leading to higher margins on positions and thereby leading to further forced selling to liquidate positions in the same as well as other segments to provide for the increased margins and to cover up losses. Normally in such situations the government bonds and bullion are the safest places to park money, but this time the intensity of the fall was so high that nothing got spared. The markets across the globe were butchered. The US stock market, which was hovering at +2 Standard Deviation of its long-term moving average, fell down to -2 Standard Deviation within three weeks of March 2020. This is like an economic reset and reboot.

The extent of bearishness in terms of magnitude and time happened almost instantaneously, current valuations thereby being indicative of discounted potential earnings two years hence. The stock markets after such a crash normally bounce back with a vengeance. Barring certain sectors like tech, telecom, pharma and others which have benefitted tremendously from the current situations, markets have remained subdued primarily on account of uncertainty of full restoration of pre-covid economic activities.

Lockdown of the key global economies led to crude oil trading in negative territory mainly due to lack of demand and lack of storage capacity due to excessive production because of reluctance on part of OPEC to cut back production.

As the lock down opens up progressively in various countries, the countries themselves are likely to remain isolated due to fears of corona virus spread through a second wave, bringing international travel to a grinding halt. Many of the international airlines are on the verge of bankruptcy while a few have already declared themselves bankrupt.

The local economies are likely to limp back to normalcy as they open up under respective guidelines of relaxation of operations and release of social distancing norms. Structural shifts in demand patterns resulting from the necessity of work/ operate from home has affected locomotion and consequent demand in the automotive sector. The fear of corona virus has accentuated and accelerated the shift in behavioral, spending and demand patterns of the local populations, the results and outcomes of which will crystalize and be visible in due course of time and some of these patterns may become permanent for times to come.

In all this pandemonium there is a silver lining which can hopefully cushion and support weak financial markets, albeit for a very short term of a month or two.

A weak dollar may lead to increased local consumption which may potentially bring buoyancy to international trade. The weakness of USD reflected in the charts may be the result of lower volumes in international trade, lower oil demand and probable general weakness in the currency.

Here are two charts which are indicative of probable weakness of the USD.


While dollar may remain bearish till end of 2021, it can at best only cushion the fall of bearish global financial markets.

For more charts and continued guidance, the author can be contacted at: riskadvisory@outlook.com.

DISCLAIMER:

These extracts from my trading worksheets/books are for the purpose of education only. Any advice contained therein is provided for the general information of readers and does not have regard to any particular person's or institution’s investment objectives, financial situation or needs and must not be construed as an advice to buy, sell, hold or otherwise deal/ trade in any single or set of commodities, currencies, indices, securities or other investments of any other form(s). Accordingly, no reader should act on the basis of any information contained therein without consulting a suitably qualified financial advisor in the first place.

Tuesday 10 March 2020

Dr. Fed’s Corona vaccine


Dr. Fed’s Corona vaccine

Fed made a surprise and unexpected 0.5% interest rate cut on Tuesday, March 3rd, 2020, last week, post telecon of G-7 Finance Ministers/ Central Bank Chiefs, wherein everyone stopped short of taking any action despite concurrence on coordinated easing.

Later in the day, Federal Reserve announced the rate cut, leading to the US$ bond/ treasury yields dropping to near zero (close to 0.5%) and simultaneous weakening of USD against Euro.

The move was targeted to provide relief to the markets and economy riddled by the impact/ damage (current and potential) of Corona virus on the global economy. The move was more of the nature of giving a shot of pain killers against a deadly disease rather than the ability to treat.

The infliction of Corona virus on the health of the global economy is visible in the form of postponed travel plans, disarrayed industrial production, inventories, supply chains, logistics, accentuation of work and study from home scenario, a single day drop in the world crude oil prices by 30% and accelerated slow down as projected by the World Bank.

The questions that cross my mind is, “Had Corona virus not struck the global markets, would the stocks have risen further?”, or “If Corona virus is brought under control, will the stock markets surge to their respective peaks?”

According to me, the answer is a firm “NO”. The markets could not have climbed relentlessly or the kind of earnings or GDP growth that the companies or the economies, respectively would have required to sustain the momentum in stock markets, would have been tremendous and hard to achieve specifically at a time when the global slowdown is visible and has been duly reported by the World Bank on numerous occasions.

Bearishness of the stock markets could have been easily predicted before the oubreak of Corona virus, by making following comparisons:

   A) Candlestick charts of Dow (monthly) during the crash of 2020 (current) and Nifty50 (fortnightly)/ BSE Sensex during the crash of 2008.


     B)  Broader candlestick pattern on charts of Nifty50 (fortnightly) during the crash of 2020 and Nifty50 (daily)/ BSE Sensex during the crash of 2008.


Crash in Dow has led to crash in global indices. This is the first wave of the global crash and the bearish phase can be expected to last longer in comparison to that in the past, following a decade long bull run.

With every problem comes an opportunity to make new structural changes and shifts in paradigms. I personally feel, the current standstill in economies of the world will lead to innovative, diversified and probably decentralised, localised and dispersed (multiple) solutions in supply chains and logistics, need for and generation of alternative sources of revenue streams for oil based economies, cheaper and focussed solutions to screen public health catering to masses and research on reducing time to provide remedial healthcare solutions from the time of identification of a potential pandemic to the time of delivering effective cure and also consequential allied disaster management and probably many more which I am unable to foresee or think of.

For more charts and continued guidance, the author can be contacted at: riskadvisory@outlook.com.

DISCLAIMER:

These extracts from my trading worksheets/books are for the purpose of education only. Any advice contained therein is provided for the general information of readers and does not have regard to any particular person's or institution’s investment objectives, financial situation or needs and must not be construed as an advice to buy, sell, hold or otherwise deal/ trade in any single or set of commodities, currencies, indices, securities or other investments of any other form(s). Accordingly, no reader should act on the basis of any information contained therein without consulting a suitably qualified financial advisor in the first place.

Sunday 10 November 2019

Fresh bull phase or signs of bearishness?

Fresh bull phase or signs of bearishness?

A quick synopsis of key events which have occurred during last 5 months summarised not necessarily in the chronological order or order of importance:

Interest Rates and QE

ECB sets the rate on deposits to -0.50% and announces QE starting this month (November 2019)

Fed reduces interest rates by a quarter percentage point and announces a pause on rate reduction in the near term.

Geo-political tensions and disruption in the global oil supplies

A variety of geo-political events happened related to Saudi Arabia, Turkey, Kurds, Syria and Iran and consequent tensions may continue in the future.

There was a drone attack on the oil facilities of Saudi Aramco which disrupted a significant percentage of global supplies but the supplies were restored in a short span of time.

North Korea resumed conducting its ballistic missile tests.

Tweets, Trade War, Tariffs

Premiers of two large economies of the world got engaged in an exchange of tweets leading to a high volatility in the global financial markets. Twitter should be grateful to these premiers for using its platform that drew lot of fan following of these Premiers.

Series of tweets and continuing trade war by way of tariffs and consequent attempt to reach an agreement by the premiers of these countries is akin to seamless streaming of the movie ‘Now You See Him Now You Don’t’ or Mr. India, the desi version, leading global financial markets on the edge.

Inverted Yields

The yields on American bonds got inverted.

Brexit

Brexit has so far seen exit of two British Prime Ministers instead of exit of Britain out of Euro Zone. The third Prime Minister attempting Brexit has adopted some unconventional means for the legislation of Brexit to go through, including holding fresh elections in December in the hope of garnering more votes for the passage of bill and meanwhile the Brexit date has been extended by the EU to January 31, 2020 upon request of the British PM.

Considering that the global indices and stock markets remained unfazed by all the above global uncertainties and moved unidirectional in the overbought zone, despite minor hiccups, it is becoming increasingly difficult to ascertain as to what factors could keep the indices scaling higher or what factors could be the possible trigger/s for the bearishness of the global stock markets in the wake of bearish signs getting developed on charts, besides visible signs of global slowdown in jobs, economic, housing and GDP data.

Since the markets are continuing to scale fresh highs or are being extremely close to the recently made highs in the preceding two quarters, many financial pundits, business channel editors and anchors advocating the ‘Buy on dips’ mantra, Chairpersons/ Managing Directors of large banks/ Housing Finance companies, big bull investors and many others have started predicting the emergence of a fresh bull phase.

However in light of the following charts, this unanimous optimism, remains a matter of discomfort:

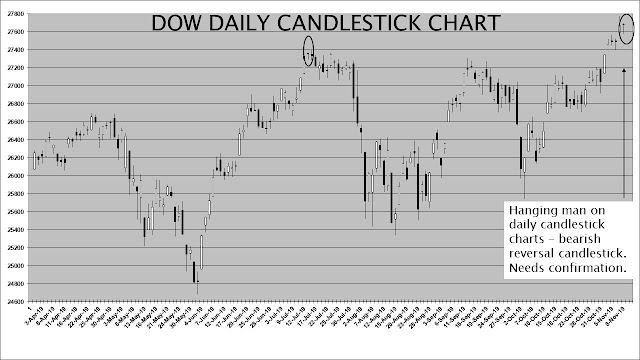
Both Dow Jones and Nifty have formed two ‘Hanging Man’ candlestick patterns on quarterly charts (bearish signs). The third quarterly chart which is under completion (will get completed by December end) on both the indices is also in the form of a hanging man (please see the quarterly candlestick charts of both Dow as well as Nifty elsewhere in this post below).

Nifty

While September Quarter hanging man has given bearish confirmation (the dark real body of the September quarter  candle covers the white real body of the preceding quarterly candle, i.e., June Quarter hanging man), the current quarter (December quarter – under completion) candle is also so far in the form of a white hanging man.

However in this case there are two observations. The index (Nifty) has not been able to cross highs of previous quarter despite announcement of a slew of stimulus measures and there are close to a little short of two months left for the quarterly candle to be complete before a conclusion can be drawn.


Meanwhile, Moody’s has downgraded India’s rating from “Stable” to “Negative.”

A day prior to the announcement of rating downgrade, Nifty formed a hanging man on the daily candlestick charts and it was followed by a drop in the index after announcement.


On weekly candlestick charts, Nifty has formed a shooting star candlestick/ doji.


Dow

In case of Dow, the three quarterly hanging man candles (third one under completion), have scaled new highs one after another.


On the last occasion, there is a formation of a hanging man on daily candlestick charts as was formed on Nifty in the second last trading session.


Excitement in the local stock markets

On home turf, a slew of measures providing intermediate and long-term financial stimulus to the economy were announced by the Finance Minister on two different occasions by way of review/ roll back of 2019-20 Central Budget provisions and Income Tax rate cuts, bringing India at par with its South East Asian peers, with the intent of attracting and inviting long term foreign capital. Combined cost of these two stimulus measures is close to or exceeds Rs.2 trillion.

With the foregoing commentary, I leave the readers to conclude for themselves the direction that the markets are going to take.

Best wishes for the festive season.


For more charts the author can be contacted at: riskadvisory@outlook.com.

DISCLAIMER:

These extracts from my trading worksheets/books are for the purpose of education only. Any advice contained therein is provided for the general information of readers and does not have regard to any particular person's investment objectives, financial situation or needs and must not be construed as an advice to buy, hold and sell or otherwise deal/ trade in commodities, currencies, indices, securities or other forms of investments. Accordingly, no reader should act on the basis of any information contained therein without consulting a suitably qualified financial advisor in the first place.

Sunday 2 June 2019

The Sino-US Trade War and Onset of Interest Rate cuts

The Sino-US Trade War – Where will it lead to?

What started as a showcase of cheap cost manufacturing base by China, luring the transnational companies to set up global scale manufacturing bases in China for mass production to suit every nation’s consumption requirements, in the decades of 1990, 2000 and 2010, with the help of huge FDIs coming in from the world’s largest economy, turned out to be a dragon trying to overshadow, outgrow and giving tough competition to the largest economy of the world, i.e., the US.

If we make an attempt to analyse and compare the two economies, i.e., the US and the Chinese, the US has an exceptionally strong currency, which helps boost consumption of imported goods, a strong ecosystem encouraging R&D, innovation and attracting talent pool from across the globe, a capitalist set up, which encourages entrepreneurship, as its key strong points amongst many others.

Contrasting that is the Chinese economy with a formidable unparalleled manufacturing base (not easily replicable by a competing country in a short span of time), a huge population to boost domestic consumption and a wide client base (countries to which China exports), a world class infrastructure which challenges that of the US, a communist government with intent and designs of territorial expansions (merely by claims and deployment of force), control over the natural resources and key strategic locations of the South East Asian nations.

With the gap between the incremental GDP of the two countries narrowing down fast; China becoming an increasingly superior technological and cyber power and a clutch of Chinese companies supplying future generation telecom equipment and mobile handsets globally with espionage capabilities; China building OBOR, threatening the sovereignty of the countries of the Indian subcontinent; having dominant presence of its naval fleet in the Indian Ocean/ South China Sea, challenging and threatening geopolitical stability in these regions, it becomes imperative for the US to curb the dominance of China or the Chinese companies actively engaged in such activities and take measures that put a check on China’s economic and cyber prowess and also its territorial expansionary tendencies. The US thinks so.

The trade war which was initiated by the US in Jan 2018 primarily against China has not seen any signs of abatement, rather on the contrary has only been exacerbated by the warring nations. The hubris of the nations to prove dominance or not to show any signs of weakness has led the two nations to go ahead with firing the ammunition in their respective arsenals with no signs or intentions by either one to blink first.

The trade war proxy seems to be the most visible sign of ego of the two nations without leading them anywhere in achieving their visible or ulterior motives. Perhaps this was the only form of war that could have been engaged in. The two nations are engaged in causing self-inflicting wounds, with the intention to hurt the other.

The latest salvo fired by the Chinese Premier is the hint of restricting/ suspending the exports of rare earth metals to USA, which find applications in US defence industry and wide range of economic activities. China has 40% of the world reserves and contributes to 70% of the global production. USA sources 80% of its rare earth metals requirement from China.

It is a widely accepted norm that China doesn’t throw a hint without a follow-up action. This indicates that it will take some time before USA could be able to meet its total requirements from sources other than China.

For a few dollars more

Microsoft is now the most valuable company of the world with the distinction of entering the trillion dollar club for just a day and giving company to Apple and Amazon. The share price of the company kept hovering just a few dollars below the rate (approx. US$ 130.5/ share) where it entered the trillion dollar mark market cap just for a day but still continues to be the most valuable company since then, ahead of Apple and Amazon.

A tribute to a karma Yogi of India

This post would not be complete without a tribute to Yogi Deveshwar, Padma Bhushan, whom India lost in the din and cacophony during the recently concluded elections in India. A true karma Yogi, he took helm of the operations of ITC in 1996 and transformed its image from being a tobacco company to that of multinational conglomerate with a strong flavour of FMCG. Yogi was the longest serving CEO of any Indian company till the time of his departure. Yogi also held many other coveted posts in various other institutions.

The company’s e-Choupal initiative finds its mention in the bestselling book, “Fortune at the Bottom of the Pyramid,” authored by Strategy Guru, C K Prahlad.

Despite the churn which keeps happening in the list of India’s most valuable companies, ITC consistently appeared in the list of top 10 companies for decades under Yogi’s able leadership.

RIP Yogi.

US Fed interest rates

In the recently released minutes of the last held Federal Reserve policy meet, the Fed has pledged continued patience and commitment to stable rates/ no rates hike regime. Fed has on many occasions given reasonable indications of easing monetary policy in future in case the US economy faces head winds.

RBI’s upcoming monetary policy announcement in first week of June 2019

With a stable government in place and visible signs of a global slowdown it is a widely formed opinion that the RBI is expected to announce a rate cut in the forthcoming policy meeting in the first week of June.

Nifty, Indices and Stocks

In light of the formation of a stable government at the centre, by a party with an absolute majority, many financial analysts are of the opinion that Nifty may see and upside of 10-15% from the current levels in the immediate future. While the long term trend of growth of the Indian economy remains intact, the following charts indicate a near term correction in Nifty.

Also given are the charts of a few other indices and stocks which indicate that the ensuing correction is expected to be a global phenomenon not linked to a particular region, country or event.

NIFTY


DOW

NASDAQ 100


APPLE


AMAZON


MICROSOFT


But the question that I keep asking myself and which remains unaddressed in my mind is this: “If the Sino-US trade war comes to an abrupt end, will the global indices scale back to their previous highs and not correct further?”

For more charts the author can be contacted at: riskadvisory@outlook.com.


DISCLAIMER:

These extracts from my trading worksheets/books are for the purpose of education only. Any advice contained therein is provided for the general information of readers and does not have regard to any particular person's investment objectives, financial situation or needs and must not be construed as an advice to buy, hold and sell or otherwise deal/ trade in commodities, currencies, indices, securities or other forms of investments. Accordingly, no reader should act on the basis of any information contained therein without consulting a suitably qualified financial advisor in the first place.