Thursday, 2 June 2016

From Cheer to Fear

From Petro Dollars to New Energy Currency

Recently there was an article on the web and in the newspapers saying that a secret pact was sealed way back in 1970s between Saudi Arabia and the US about mutual help that the two countries will extend to each other. According to this pact US will buy oil from Saudi Arabia and supply arms to Saudi Arabia and Saudi Arabia in turn invest the surplus dollars in US treasuries. Here is the link to the story for those who would be interested in understanding the details:


To me a new story emerges from here. Now that the US is self-sufficient in oil and no longer purchases oil from Saudi Arabia, the barter trade cannot continue and there can be no more purchase of US treasuries by the Saudi kingdom. In fact from now onwards the deficit of Saudi Arabia will need to be funded by sale of its reserves in US treasuries or alternate means/ borrowings/ sale of assets, etc.

What impact can Global warming have on the Global economy?

Now that there are talks of the global warming and replacement of fossils based fuels by sources of clean/ solar energy, the investments in these strong potential areas is going to grow manifolds within the foreseeable future.

The above indicates that if an energy product consumed on a mass scale (solar/ tidal energy/ stored energy/ power banks) can be bartered by mass scale products/ services (be it arms and ammunitions/ clean potable water/ wheat/ coffee/ orange juice/ provision of long term consultancy/ services) of a country and also the balance of the underlying currency payments can be reinvested in the treasuries of the country providing the bouquet of products/ services of mass consumption, the dynamics can tilt in favour of the currency of the country exporting these products/ services.

That’s not all that I wish to convey here.

How close are we to this? In which currency’s favour is the tilt going to occur?

While the new order may take decades to establish, its beginning may have already started. Newer pacts will perhaps seal the fate of the pact above mentioned or will perhaps let it not survive. The one and only factor related to the above stated shift in paradigm which keeps unsettling me or rather keeps assuring me or endorsing my viewpoint are the charts of the US Indices. Time has ushered in an era where the US supremacy is going to diminish from now onwards and will lead to a state where the strength and demand for petro dollars will also diminish.

The following post of mine may be read along with this article:


In my above post, dated 21 November, 2015, I have compared the chart of US Indices with the dated chart of Silver. The Dow Jones/ Nasdaq Composite have taken another dip since the above post and also recovered subsequently forming a Triple Top. To my knowledge, a Triple Top is a bearish pattern but I am amazed how the resilience of the US Indices have changed the stance of many a technical analysts who have started believing that if the indices/ markets break certain resistances, the markets are in for a fresh bullish wave.

While I do agree that anything can happen in financial markets, I do not put on blinkers or follow the market/ technical analysts blindly.

The duration of the multi-period employed in my post of November 21, the link for which is given above, has now been extended by me in my current post. Besides the line graphs and the newer duration multi-period adopted for the candlestick charts, I am also presenting a unique proprietary combination of multiple (set of three) stochastics drawing comparison between the charts of Silver and Dow. Need I say anything more on the direction of the markets from here?

The Eccentricity of Extrapolation of the Economists and the Statisticians

During my graduation, one of the professors gave an example which I always cite as a humorous analogy: “If you keep the lower half of a person in a furnace and the upper half in a refrigerator, on an average he should be feeling fine.”

By the same yardstick if we extrapolate the US economy and the Indian economy, the Indian economy will reach moon sooner than the US economy.

The Frustrated Fed

Why is the Fed hell bent on raising the interest rates? If the near zero interest rates have taken the US Indices/ economy to the stratospheric heights, the Fed should continue to maintain the rates. According to extrapolation employed by Fed, the US GDP/ economy should continue to grow at a sustainable rate. Then why should it tinker with the interest rates at this juncture?

Somewhere deep within its heart, the different and diverse forces/ representative members of FOMC feel that all is not well and there is something else brewing up which is not revealed/ apparent to the common man. There are perhaps various imbalances/ bubbles (be it an imbalance or a bubble in the stock market or treasuries market or any other financial market) created by a single steadfast policy decision of near zero interest rates under the guise of single steadfast objective of the target unemployment rate (to hell with anyone/ anything else which comes in/ on the way).

The Success of the Manipulative Market Makers

Dear Fed, the Market Makers have succeeded to make the public believe that the extrapolation of sustained/ projected growth rates will take the US GDP/ economy/ Market Indices to higher levels from here.

Triggers for a correction

Many people ask me as to what would be the triggers for a correction? I tell them that the triggers are always built in the system. It all depends upon when does the media or the policy makers wish to make them public.

While I am not at all trying to make an attempt to hint that the data being reported is wrong or manipulated, all that I am attempting to say is that agencies compiling the data have a first-hand feel of the anomalies about to happen in the near future but these anomalies get guised under the averages or many of the data reported are not perfect lead indicators.

Short-sightedness of a Consultant friend

A consultant friend of mine who claims to be closely working with the government claims that the Indian stock markets are not going to fall further. I can only say that one cannot piss or fart against the wind. If the big daddy sneezes we get the cold.

From Cheer to Fear

Here below are the newer comparative charts along with the proprietary stochastics (technical indicators) that indicate the soon to be direction of the US Indices.


Contact:
Author can be contacted at riskadvisory@outlook.com.

Disclaimer:

These extracts from my trading books are for educational purposes only. Any advice contained therein is provided for the general information of readers and does not have regard to any particular person's investment objectives, financial situation or needs and must not be construed as advice to buy, hold and sell or otherwise deal in any kind of commodities, currencies, securities or other investments. Accordingly, no reader should act on the basis of any information contained therein without first having consulted a suitably qualified financial advisor.

Sunday, 29 May 2016

Expect Some Fireworks

Expect some fireworks to occur in the months of June and July in the financial markets incuding commodties.

Tuesday, 5 April 2016

Donald Trump May Prove To Be Right

Donald Trump May Prove To Be Right

I read in a latest web news Donald Trump saying that the markets are overheated and they are going to crash. For a change there is someone who is blowing the warning trumpet. Till now I used to be amazed how irresponsibly the Fed has put on the blinkers and is marching relentlessly towards the goal of least unemployment (terming it a mandate to justify near zero interest rates) without considering/ ignoring all the signs of an imminent crash, appearing on the expressway of the Wall Street going uphill and eventually going to lead to The Valley of Fear, which may or may not be visible to the economists as of now or perhaps they don’t wish to be the naysayers so as to displease the vested interests despite witnessing and recognising all the signs.

Here is someone who is familiar with the environment and perhaps the ground realities too. Whether he is the right presidential candidature choice or not may be a different matter altogether and for that matter the same may hold good even for the Democrat in the fray for the presidential elections.

Fed should perhaps, at least NOW, remove its blinkers and see for itself that instead of leading the recovery and launching the economy into a healthy orbit, it has in reality played the game of ‘Snakes and Ladders’ wherein towards the end of the game on the topmost row, whatever number the thrown dice may show up, there is a snake in the form of good news or bad news sitting silently coiled so many squares away. Each square is going to lead to a ride or slide – by whatever name the Fed may call it – many miles below.

Instead of deciding on which policy statement to play in the next FOMC meeting, it will be prudent on part of the Fed to decide on the kind of safety net it should be providing for the Americans lest it may end up playing a bigger game of US$ 8 trillion QE starting MIDDLE OF THE YEAR or sooner.

Here are the charts which in my wisdom support Trump and his statement.


Of the two indices shown above, Nasdaq Composite gives a better indication of the things in the offing and looks more scary in comparison to Dow.

Contact:
Author can be contacted at riskadvisory@outlook.com.

Disclaimer:
These extracts from my trading books are for educational purposes only. Any advice contained therein is provided for the general information of readers and does not have regard to any particular person's/ organisation’s investment objectives, financial situation or needs and must not be construed as advice to buy, hold and sell or otherwise deal in any kind of commodities, currencies, securities or other investments. Accordingly, no reader should act on the basis of any information contained therein without first having consulted a suitably qualified financial advisor.

Tuesday, 1 March 2016

Upto 20% off on USD - Currencies Special - USD, EUR, JPY, GBP, AUD, CHF, INR

Upto 20% off on USD

Sounds bizarre. Is it some kind of scheme going on? Not exactly. All the same, US dollar is going to be off 20% from its peak reached against majority of the currencies in the recent past within next two-six months from now.

This is one scheme which offers a lot of opportunities for punters and organisations alike, but how many of them will be able to avail of the scheme is yet to be tested. Many of them would perhaps be on the other side of the table and may actually suffer losses depending upon how severe will be the speed of fall, because the general tendency of the individuals and organisations – specifically in case of USD – is to remain long in the so perceived safe haven currency/ asset.

Potential impact of a dropping foreign currency

Export oriented organisations see corresponding loss in earnings in domestic currency due to weakening foreign currency, whereas import oriented organisations benefit due to lower cash outflows.

Similarly, organisations having dollar denominated liabilities benefit from the downsized liabilities, when these are translated in local currency on the balance sheet, whereas, there is a corresponding diminution in the value of dollar denominated current and long term assets when translated in the domestic currency, resulting in higher provisions/ depreciation in the books of accounts.

This is simply theory. The real test will be that of the Central Banks as to how effectively they will be able to absorb and cushion the impact of the volatility arising out of a fluctuating and falling foreign currency so as to have least impact on the profitability of the local businesses.

While looking at some of the charts below, it is evident that the fluctuating currencies will have the potential to rock the financial markets and cause a significant impact on the operations and the balance sheets of the organisations having foreign currency exposures. Organisations which will prove to have the resilience and wherewithal to manage and/ or in an unlikely situation absorb the impact of the turbulence arising out of the fluctuating foreign currencies will be able to survive in the long run. Rest may get dwarfed or wiped off.

Turbulence in the currency markets is here to stay for a longer period than most of us are able to think of or imagine.

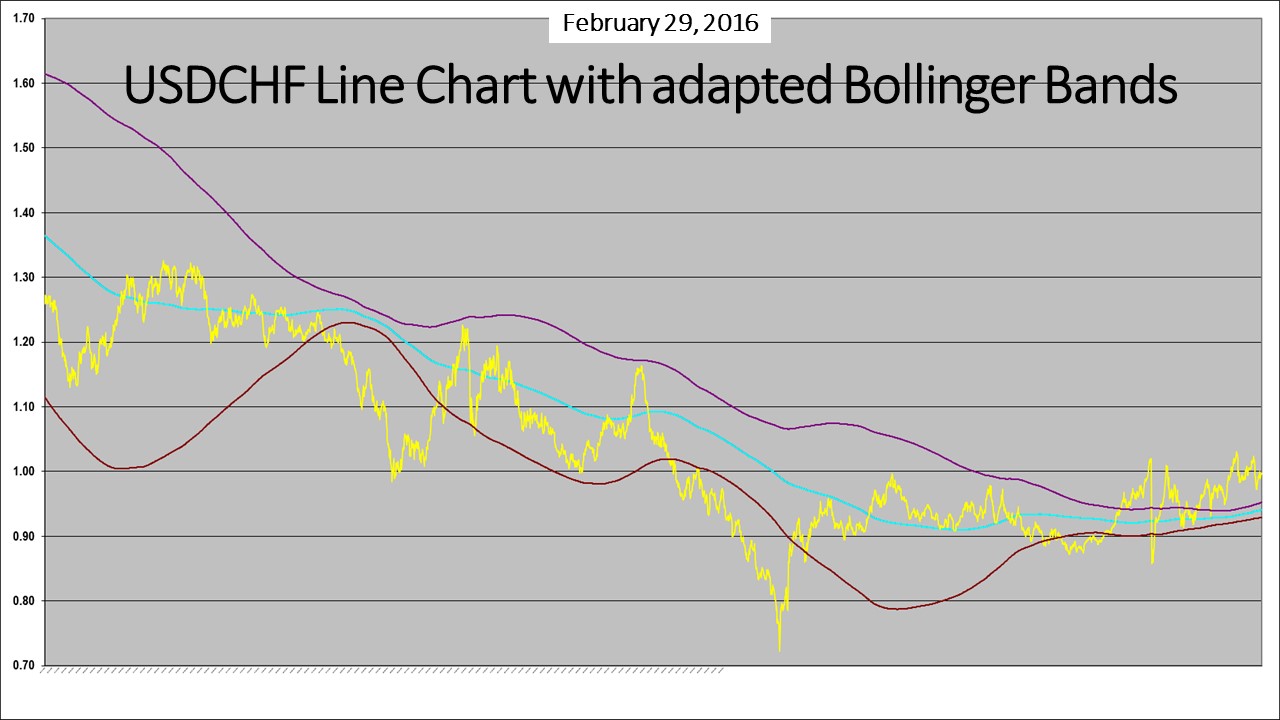
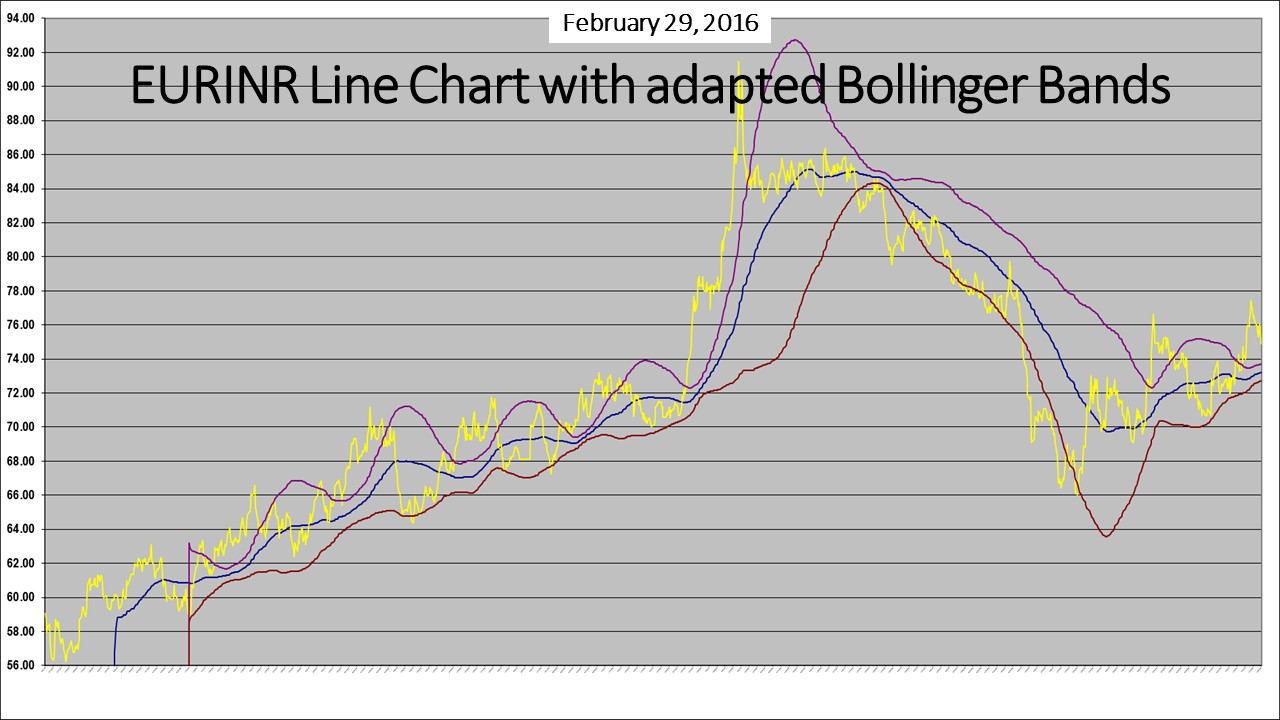
Here are the charts of some of the prominent international and domestic currency pairs:

USDEUR


USDJPY


USDGBP


USDAUD


USDCHF


USDINR


EURINR


JPYINR


GBPINR


USD has commenced a confirmed bearish phase against Euro and JPY, whereas it is stalled at the resistance levels against GBP and AUD (Australian Dollar) from where it is very much likely to retreat. CHF (Swiss Franc) which has a strong link with Euro is most likely to follow Euro’s strength against USD despite having a stable and lesser volatile parity with USD.

In the Indian context, USD has peaked against rupee, which is evident from a host of adapted Bollinger Band charts, multi-period candlestick charts (please refer to my previous posts on the blog) and other technical indicators. A strong Euro, JPY and GBP against USD will lead to strength against INR as well.

Contact:
Author can be contacted at riskadvisory@outlook.com.

Disclaimer:

These extracts from my trading books are for educational purposes only. Any advice contained therein is provided for the general information of readers and does not have regard to any particular person's investment objectives, financial situation or needs and must not be construed as advice to buy, hold and sell or otherwise deal in any kind of commodities, currencies, securities or other investments. Accordingly, no reader should act on the basis of any information contained therein without first having consulted a suitably qualified financial advisor.

Sunday, 7 February 2016

Year 2015 – End of an Era – The fading away of USA and USD

Year 2015 – End of an Era – The fading away of giants

Year 2015 will mark the end of an era in the chapters of History of World Economics. Two mighty giants – the USA and the PRC (People’s Republic of China) who grew too big for the world economy in their quest for their economic might with combined GDP in the region of USD 25 trillion will be gradually overshadowed by the trailing economies, viz., the Eurozone, BRIC nations minus China, due to slowdown in these two economies.

Well, well, well……..

That is a bold statement to make and who would live that long to make an assessment of the foregoing statement. Yet let me make an attempt to support my statement.

Mistakes of the past

Sometimes the mistakes of the past haunt you so much that they don’t let you go far.
I am referring to the mistakes made by the US and Chinese policy makers. I shall now be taking the specific case of the US economy.

Two wrongs never make a right and US has just done that. Within the last ten years the US has made two wrongs which will be severely punished by the laws of the economics and it will take decades for the US economy to recover from the aftershocks of the financial tsunamis that it has brought to the world. The first one was financial crisis caused by the subprime borrowing. The second one was to hike interest rates at an inappropriate time (it should have done it long back) when the stock markets are in a highly speculative zone. The second financial tsunami is underway and has just begun. The complete wave of the US stock markets correction will determine the extent of the aftermath of the stock markets correction.

The manipulated USD and its consequent impact on the world economy

The USD has been a strong yet manipulated currency since decades which has always benefitted the US economy. A strong economy feeds the currency and vice versa. Both feed each other so much that sometimes the cause and effect relationship is lost. The trend finds its way to glory till the underlying weaknesses emerge publicly.

Why has the US economy grown while the other economies are still struggling to survive or grow at a decent rate?

A strong USD has hurt the growth of the world economy by causing deflation the world over in the commodities market, whereas it has helped consumerism in the US by way of cheaper imports.


The policies of the Fed during the last eight year, led to channelizing of funds of the US economy to a super inflated stock market and a rigged and manipulated currency not having adequate underlying strength. Both, the stock markets and the currency have outlived their real strength. We have already witnessed the bearishness of the US stock markets starting Jan 2016 and the economic data pouring in is also not too healthy.

Turbulent US economy and the USD in times to come

A manipulated strong USD and the flawed policies of the Fed have led to forced consumerism in the US economy by not giving adequate options to the US citizens to save – save for the rainy day.

The trend of the US stock markets and the USD – supported by the flawed policies of the Fed – have forced the world to believe in the paradigm that we have entered into an era of negative or zero interest rates. Perhaps new laws of economics will emerge over a period of time which I, in my personal capacity, cannot imagine at this stage. But I do believe in the fact that the laws of cost of capital will remain intact.

A project cannot be made viable by lowering the cost of capital. A project remains viable by its sheer inherent strength, strong natural demand and its economic NPV or IRR. The stress tests on the variables of a project determine the viability and strength of the project in times of stress and not the variability of the cost of capital.

With a strong and steep correction of the stock markets underway in the US, the US economy and the USD will remain weak until cows come home, because at this juncture the Fed and Uncle Sam are not left with much economic ammunition and options to revive the economy.

A weak dollar coupled with emergence of other stronger economies and currencies will lead to the limited powers of spending of and by the US citizens and Uncle Sam, leading to a decline in the financial might and prowess and consequent lesser strength in the arena of world economics and other geopolitical platforms.

Consequently the USD will remain a turbulent and unmanageable currency in times to come.

Charts of US stock market and USD


Contact:
The author can be contacted at riskadvisory@outlook.com.

Disclaimer:

The extracts from my trading books are for educational purposes only. No attempt is being made to give any kind of advice to anyone. The contents are for the general information of readers and does not have regard to any particular person's investment objectives, financial situations or needs. Consequently the contents must not be construed as an advice to make investments, sell, hold or otherwise deal in any or a set of currencies, commodities or any other kind of assets. Accordingly, no reader should act on the basis of any information contained therein without first having consulted a suitably qualified financial advisor.

Saturday, 2 January 2016

Crude Oil - WTI (INR and USD) - January 2016

Crude Oil – WTI (INR and USD)

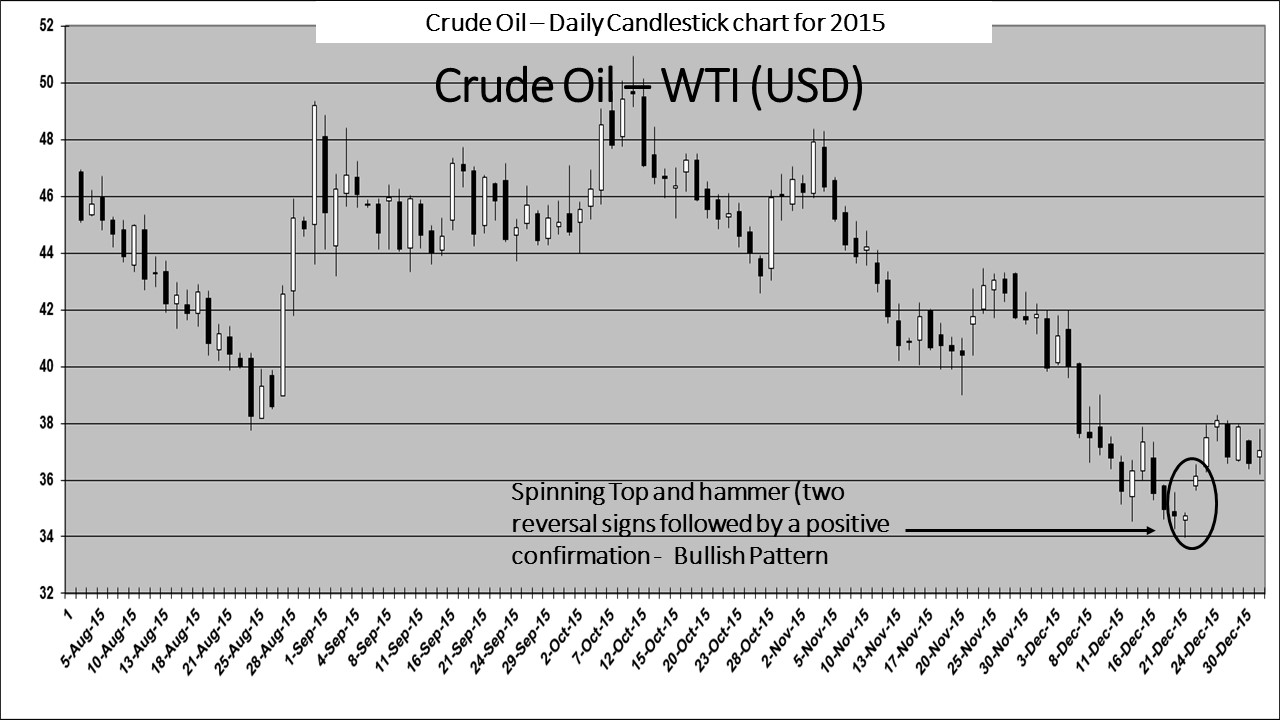
Talks are abuzz that Crude Oil is going to fall further. There is news that there may be far excess supply in 2016 than what the global markets may be able to absorb and that the crude carrying ships are being used as storage capacities and crude is being ferried to the farthest destinations so as to increase the transit time for very well-known reasons.

However the most recent candlestick chart patterns of WTI (INR and USD) have thrown up some surprises. While a few of them have been followed by positive confirmations, a positive confirmation is yet to follow on fortnightly and monthly candlestick charts (INR and USD).

The adapted Bollinger Bands do not yet give any indication of formation of a squeeze and a consequent reversal of trend, yet it seems after combining all the above factors that Crude Oil is in a consolidative phase and at least for now the rates have stabilised.

A bullish phase would be confirmed with the formation of a white candle on the monthly candlestick charts and with the initiation of the formation of a squeeze on adapted Bollinger Bands.


Best wishes for the New Year 2016.

Contact:
The author can be contacted at: riskadvisory@outlook.com.

Disclaimer:
These extracts from my trading books are for educational purposes only. Any advice contained therein is provided for the general information of readers and does not have regard to any particular person's investment objectives, financial situation or needs and must not be construed as advice to buy, sell, hold or otherwise deal with any commodities, currencies, securities or other investments. Accordingly, no reader should act on the basis of any information contained therein without first having consulted a suitably qualified financial advisor.

Saturday, 5 December 2015

Blame It On Fed and ECB

Blame it on Fed and ECB

Since my last post titled “The Final Countdown – Indices Special” on November 21, 2015, two events of significance have occurred, viz.:

·         ECB reduced deposit rates by 0.10% to negative 0.30% and announced QE amounting to 360 billion euros extended till 2017
·         Fed chairperson’s testimony to the US Senate and persistence in view to get off the near zero interest rate tiger in light of robust US economic and jobs data indicating adequate and continued strength in the economy

The spontaneous reaction of the financial markets to ECB’s decisions was clearly visible in the currency and stock markets.

However these events left me in a confused state of mind. The confusion arose on the following accounts:

·         Why is Fed hell bent to raise interest rates on 15th-16th December 2015, when it did not raise it at times when the US economy and the stock markets were doing so well for many years in the recent past?
·         Why does the ECB have to reduce the deposit rates? What was the rationale behind this move to bolster Euro and how effective will be the ECB’s bond buying program of 360 billion euros to strengthen the Euro Zone economy?

NOW I AM CONVINCED THAT:

·         Central Banks do make mistakes and
·         Sometimes Central Banks make mistakes in series by their inaction/ wrong actions at wrong times and
·         They also:
o   Let the blame fall on themselves, and
o   Empower financial markets to prove that the Central Banks act wrong

Listening/ reading about Fed’s/ ECB’s statements, its actions/ inactions and listening to the subsequent commentary of the analysts has finally kicked my spirit this time to interpret these statements and actions.

I will make an attempt to interpret these in my way.


A. Fed’s Decision to raise the interest rates – Biggest Blunder by Fed as far as timing is concerned – Enjoy the roller coaster at FeDisneyland

I admit that the US economy is robust at this moment but the best milestone/ time to have lifted the cap has been left way behind in time; perhaps almost two years and a quarter back in time. Now that the US stock markets/ Indices are at their peak and ripe to show some ‘Correction’, raising interest rates at this juncture will only lead to the blame of ‘Correction’ being put on the Fed. Fed has already sown the thoughts of ‘Correction’ with the markets.

Please read the news article below. This article appeared on Bloomberg’s website:

According to October's FOMC statement, Fed officials believe "it will be appropriate to raise the target range for the federal funds rate when …….."

According to Yellen today, she currently judges that "US economic growth ……2 percent". In short, she believes the conditions for a rate hike have been met.

Declaration came with the usual caveats: It is data dependent and a really bad November payrolls figure
or some other negative shock (perhaps another dip in the stock market like we saw in August) could yet persuade the Fed to hold fire.

"We don't expect ….., so we have to assume that a rate hike is coming", says Capital Economics in a research note.

Beyond the first rate hike, Yellen stressed ………..zero. But frankly that estimate is 90% guesswork.”

My Interpretation

The Fed chairperson has handed over the tool for not lifting the interest rate cap in the hands of the Wall Street.

·         Message for Wall Street: When the option is available, exercise it.

In my opinion the damage is done now. Interest rate cap lift-off could have been deferred


B. ECB’s decision of QE to the tune of 360 billion euros

My Interpretation

No doubt that robust stock markets support the economy. When the stock markets are highly speculative and are due for correction, any quantum (be it “Too little” or adequate) of bond-buying will not lead the stock markets any higher. The effort of bond-buying program will be a waste.

The markets reacted by saying “Too little.” Here also the tool to put the blame on ECB was handed over by ECB itself to the markets.

In my opinion announcement of QE should have been deferred.

There has been no significant change in the graphs presented in my previous post. All my previous views/ stances remain intact.

Best wishes for the festive season.


Contact:
The author can be contacted at: riskadvisory@outlook.com

Disclaimer:

These extracts from my trading books are for educational purposes only. Any advice contained therein is provided for the general information of readers and does not have regard to any particular person's investment objectives, financial situation or needs and must not be construed as advice to buy, sell, hold or otherwise deal with any commodities, currencies, securities or other investments. Accordingly, no reader should act on the basis of any information contained therein without first having consulted a suitably qualified financial advisor.