An Update on Nifty
Since
my last post on Nifty on April 5, 2017, a few significant geopolitical events have taken place, viz., the US unilateral attack on the Syria on
April 6, 2017, dropping of the largest non-nuclear bomb on hideouts of ISIS in
Afghanistan on April 13, 2017 and deployment of US strategic assets (anti-missile
systems in South Korea) and Air Force and Military troops near the borders of
North Korea under the guise of military drills/ exercises with the real intention to
counter any missile launch/ attack by the North Korean regime.
Media
reports say that a failed missile launch on April 16, 2017 diffused the existing
tension. Can we conclude that a missile launch could have led to the break-out of a
war or it could have caused a conflict in the region?
In
March 2014, at the time when Malaysian MH-370 went missing in the South China
Sea, Russia had annexed Crimea and in September 2014 the self-declared
republics of Donetsk and Lugansk were being supported allegedly by Russia.
However it was interesting to note that the vanished MH-370 hogged the media limelight
for a very long period of time and the news of usurping of Crimea by Russia
largely got under reported.
Was this
under reporting deliberate? Was it because of control of media by the US administration?
Is the media being controlled by the US administration directly or indirectly?
Is the
missile launch by the North Korean regime more prominent at the present moment in
comparison to previous years (North Korea has been launching missiles since many
years)? Have the tensions in the South Asian region heightened now within a
week’s time or these existed even earlier and had gone unnoticed or not felt by the media?
Is the
media deliberately reporting now about a war like situation or creating a
situation which is harbinger to a war?
To me the
present situation pertaining to North Korea looks more like a James Bond movie or
a sequel of Mission Impossible with the theme music playing in the backdrop trying
to create sound effects to make the viewers of the movie sit on the edge while Mr.
Bond or Mr. Hunt performs feats which perhaps even a Navy Seal may not be able
to perform in real life. At the end of the movie everyone is happy with the
entertainment without any real life violence.
To me
it will always be a puzzle as to how the financial markets are able to time the
events?
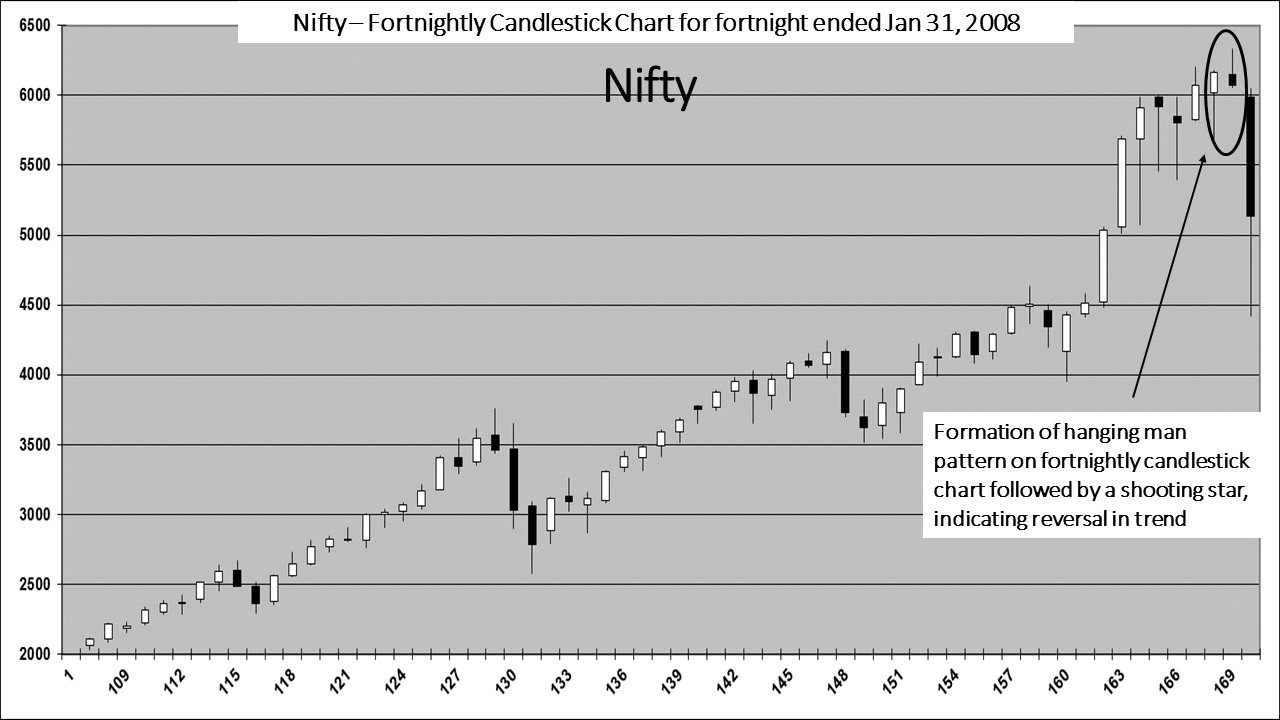
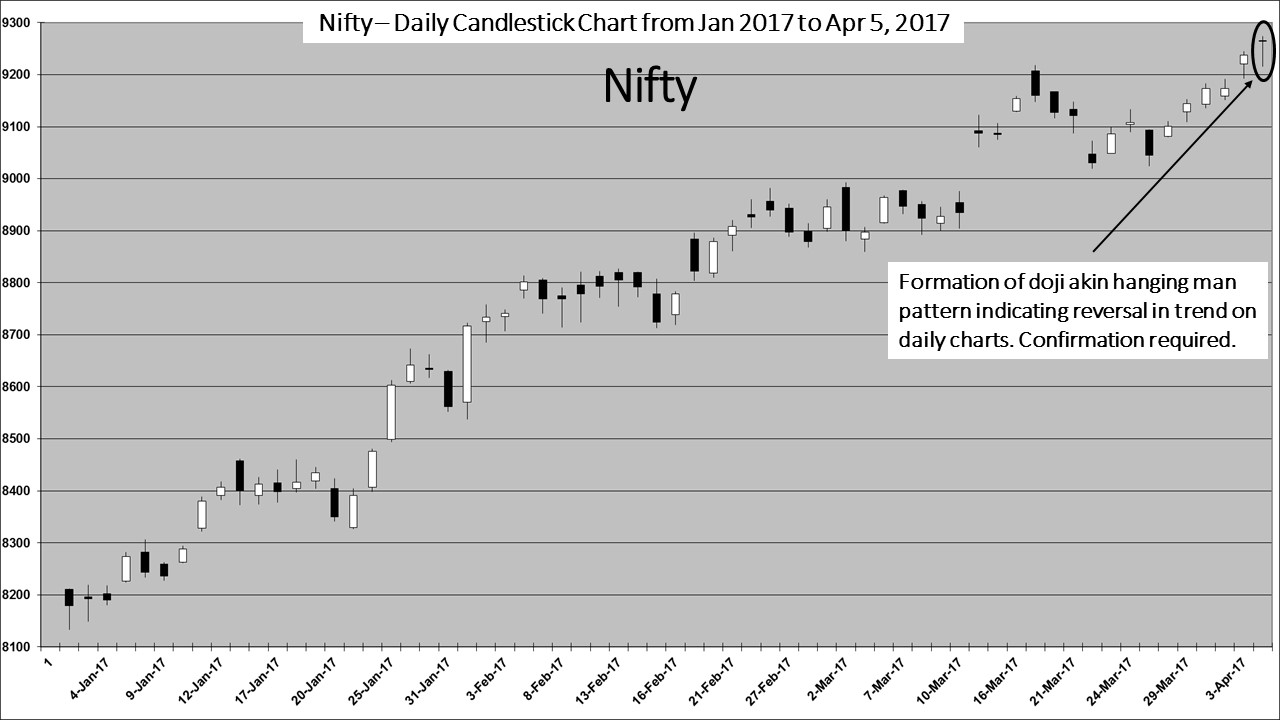
Here
below are two strikingly similar fortnightly candlestick charts of Nifty
indicating bearishness.
DISCLAIMER:
These
extracts from my trading files are for the purpose of education only. Any
advice contained therein is provided for the general information of readers and
does not have regard to any particular person's investment objectives,
financial situation or needs and must not be construed as an advice to buy,
hold and sell or otherwise deal in commodities, currencies, indices, securities
or other forms of investments. Accordingly, no reader should act on the basis
of any information contained therein without consulting a suitably qualified
financial advisor in the first place.