THE
FINAL COUNTDOWN
I am publishing this
article a bit ahead of my usual schedule as I find a lot of mismatch in published
news articles and what the charts tell me.
What
The NEWS says
·
“Fed
is all set to lift off the rate cap and Fed has given assurance that the rate
increases will be gradual.”
·
“Markets
rise to give thumbs up to the Fed’s decision of gradual rate increases.”
·
“In
the minutes of the last FOMC meeting, specific phrases/ set of words have been
replaced with another set of words, which means that Fed will be compelled to
increase the interest rates in the coming December FOMC meeting.”
Such news items I keep
reading on various websites and in various articles. Various analysis have been
made and aired.
The minutes of the last
FOMC meeting are available on the net also. Given below is the link:
Honestly, for me it is
tough to interpret the words selectively chosen by Fed and somehow I get a feel
that the Fed dances to the tune of the Wall Street to carefully choose the
words to convey a message what the Wall Street wishes to listen. So much hype
is created around these two events (the FOMC meetings and the release of the
minutes) that I sometimes feel that the minutes of the meeting are virtually
dictated by the Wall Street through the hype generated through the published news
articles.
AND
What
the CHARTS foretell
The
Final Countdown
I am fascinated by the
charts and technical indicators generated by silver. Silver is considered to be
one of the most speculative and volatile commodities and the most tough to
interpret and follow. Yet I draw a lot of inspiration and references from the various
charts of silver and the technical indicators/ parameters generated by the data
of silver.
The
Markets/ Indices remain bearish
Therefore in my present
article I will draw reference from one of the old charts of silver, without
drawing any conclusive downward targets and at the same time continuing to maintain my previous stance
that the markets are bearish and also that
now the ‘Final Countdown’ has begun.
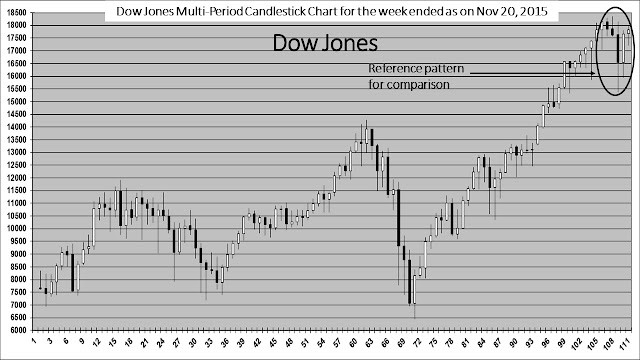
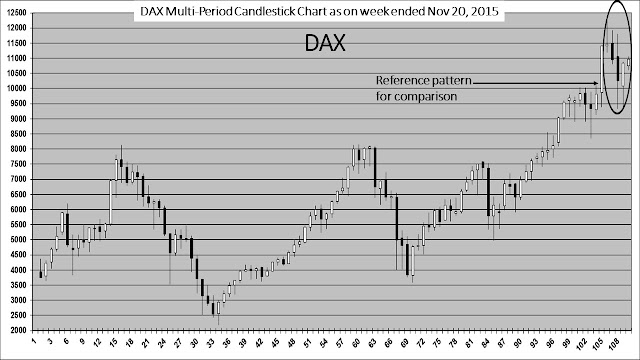
Please note that for the
multi-period charts shown below, the completion period is either approximately a
week away or about a month and a week away. Though a lot can happen in a week’s/
a month’s time, yet approx. 100 points or so up from here will not at all alter
the reference patterns and my stance. Approx. 100 points or more below the current
levels will only strengthen my stance. Moreover, during the formation of such
reference patterns, the patterns are usually not sustainable for a long period
of time and therefore their snapshot picture formation is more important than
sustainability of formation.
I do not wish to give
targets to my readers (the most common asked question from the readers of my
blog), simply because I do not drive the market. Secondly, although the past identical/
similar patterns give a good reference, yet these may or may not yield the similar
outcomes/ returns. Thirdly, the art or science of calculation of targets is
still a mystery for me. I just simply know that as a thumb rule, previous peaks offer targets or resistances.
Best wishes for the
festive season.
Contact:
The author can be
contacted at: riskadvisory@outlook.com
Disclaimer:
These extracts from my
trading books are for educational purposes only. Any advice contained therein
is provided for the general information of readers and does not have regard to
any particular person's investment objectives, financial situation or needs and
must not be construed as advice to buy, sell, hold or otherwise deal with any
commodities, currencies, securities or other investments. Accordingly, no
reader should act on the basis of any information contained therein without
first having consulted a suitably qualified financial advisor.


No comments:
Post a Comment