Saturday, 21 November 2015

The Final Countdown - Indices Special - Nasdaq 100, Nasdaq Composite, Dow Jones, DAX

THE FINAL COUNTDOWN

I am publishing this article a bit ahead of my usual schedule as I find a lot of mismatch in published news articles and what the charts tell me.

What The NEWS says

·         “Fed is all set to lift off the rate cap and Fed has given assurance that the rate increases will be gradual.”
·         “Markets rise to give thumbs up to the Fed’s decision of gradual rate increases.”
·         “In the minutes of the last FOMC meeting, specific phrases/ set of words have been replaced with another set of words, which means that Fed will be compelled to increase the interest rates in the coming December FOMC meeting.”

Such news items I keep reading on various websites and in various articles. Various analysis have been made and aired.

The minutes of the last FOMC meeting are available on the net also. Given below is the link:

Honestly, for me it is tough to interpret the words selectively chosen by Fed and somehow I get a feel that the Fed dances to the tune of the Wall Street to carefully choose the words to convey a message what the Wall Street wishes to listen. So much hype is created around these two events (the FOMC meetings and the release of the minutes) that I sometimes feel that the minutes of the meeting are virtually dictated by the Wall Street through the hype generated through the published news articles.

AND

What the CHARTS foretell

The Final Countdown

I am fascinated by the charts and technical indicators generated by silver. Silver is considered to be one of the most speculative and volatile commodities and the most tough to interpret and follow. Yet I draw a lot of inspiration and references from the various charts of silver and the technical indicators/ parameters generated by the data of silver.

The Markets/ Indices remain bearish

Therefore in my present article I will draw reference from one of the old charts of silver, without drawing any conclusive downward targets and at the same time continuing to maintain my previous stance that the markets are bearish and also that now the ‘Final Countdown’ has begun.

Please note that for the multi-period charts shown below, the completion period is either approximately a week away or about a month and a week away. Though a lot can happen in a week’s/ a month’s time, yet approx. 100 points or so up from here will not at all alter the reference patterns and my stance. Approx. 100 points or more below the current levels will only strengthen my stance. Moreover, during the formation of such reference patterns, the patterns are usually not sustainable for a long period of time and therefore their snapshot picture formation is more important than sustainability of formation.


I do not wish to give targets to my readers (the most common asked question from the readers of my blog), simply because I do not drive the market. Secondly, although the past identical/ similar patterns give a good reference, yet these may or may not yield the similar outcomes/ returns. Thirdly, the art or science of calculation of targets is still a mystery for me. I just simply know that as a thumb rule, previous peaks offer targets or resistances.

Best wishes for the festive season.

Contact:
The author can be contacted at: riskadvisory@outlook.com

Disclaimer:

These extracts from my trading books are for educational purposes only. Any advice contained therein is provided for the general information of readers and does not have regard to any particular person's investment objectives, financial situation or needs and must not be construed as advice to buy, sell, hold or otherwise deal with any commodities, currencies, securities or other investments. Accordingly, no reader should act on the basis of any information contained therein without first having consulted a suitably qualified financial advisor.

Sunday, 1 November 2015

Indices Update - November 2015

Indices Update – November 2015

The next meeting of the Federal Open Market Committee (FOMC) is scheduled for December 15-16, 2015. While there is a lot of hype created around rate hike by Fed, all successive meetings of the FOMC in the past have not been successful in increasing the rates so far despite a long stretch of period of superb data announced for past so many years.

Whatever may have been the set of reasons for the two Fed chairpersons, Mr.Bernanke and Ms.Yellen, for not increasing the interest rates, at various milestones in the past, it will now be increasingly tough for the incumbent chairperson to announce a rate hike in the near future in wake of the slowdown in the US and parts of the global economy.

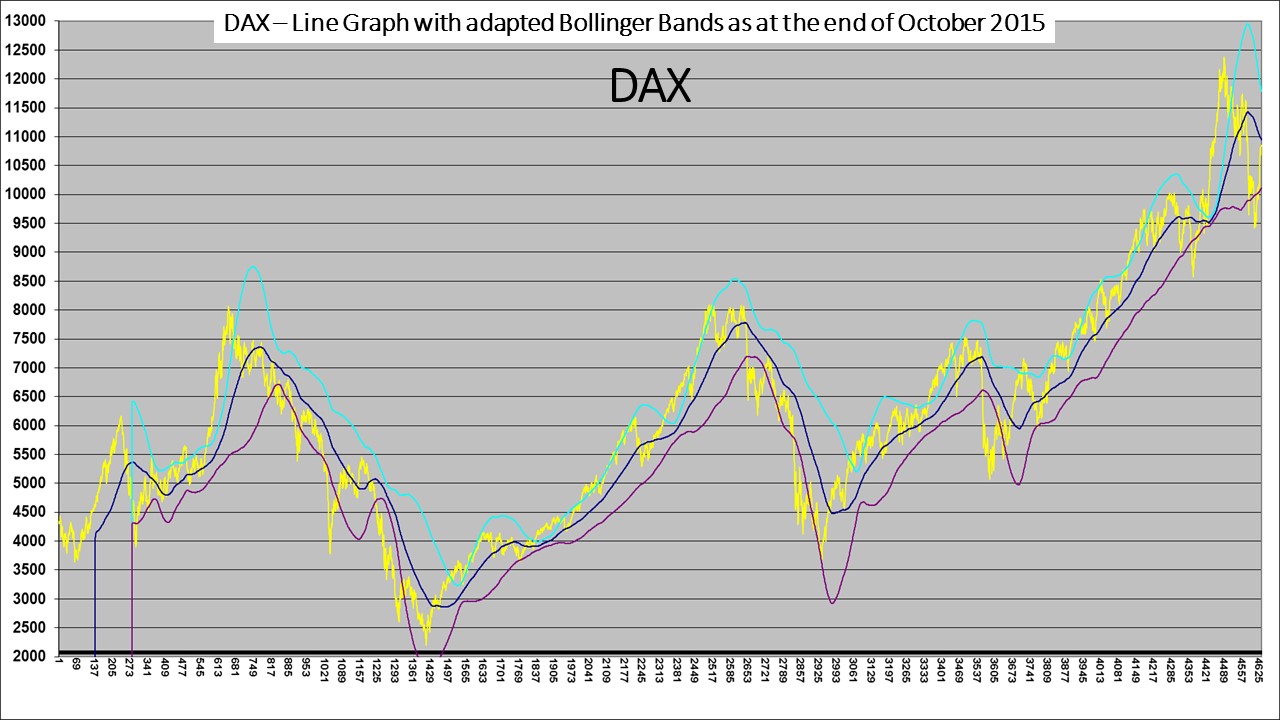
I continue to maintain my view as mentioned in one of my previous posts that the US stock market indices, DAX and Nifty are at a stage from where the journey is only sideways to downwards. The festive season may bring some cheer to the indices in terms of sales/ consumer spending but that will only be a temporary respite.

Given below are the updated charts of Nifty, Dow Jones, DAX and Shanghai Composite (SSEC) till October 2015.


Best wishes for the festive season.

Contact:
The author can be contacted at riskadvisory@outlook.com

Disclaimer:

These extracts from my trading books are for educational purposes only. Any advice contained therein is provided for the general information of readers and does not have regard to any particular person's/ corporation’s investment objectives, financial situation or needs and must not be construed as advice to buy, sell, hold or otherwise deal with any commodities, currencies, securities or other investments. Accordingly, no reader should act on the basis of any information contained therein without first having consulted a suitably qualified financial advisor.

Gold and Silver Update - November 2015

Gold and Silver

Given below are updated charts of Gold and Silver for the period ended October 2015.

Both the precious metals have formed another reversal pattern on their multi-period candlestick charts.

The line charts (INR) with adapted Bollinger Bands of both the precious metals have formed a squeeze indicating and confirming reversal of the trend indicated on the candlestick charts.


Best wishes for the festive season.

Please feel free to seek any clarification.

Contact:
The author can be contacted at riskadvisory@outlook.com

Disclaimer:
These extracts from my trading books are for educational purposes only. Any advice contained therein is provided for the general information of readers and does not have regard to any particular person's investment objectives, financial situation or needs and must not be construed as advice to buy, sell, hold or otherwise deal with any commodities, currencies, securities or other investments. Accordingly, no reader should act on the basis of any information contained therein without first having consulted a suitably qualified financial advisor.

Saturday, 31 October 2015

USDEUR and USDINR - Update - November 2015

USDEUR and USDINR

With the conclusion of the recent FOMC meeting and release of its policy decisions on October 28th at 2:00 p.m. US time, which coincides with 11:30 p.m. IST, the USD immediately became volatile and strong against EUR and the strength of USD also reflected against the INR the following day. Such sudden and knee jerk reactions are normally precursors and a confirmatory signal to the change of trends. The knee jerk reactions are a sign of reversal of positions by punters and market makers who have large exposures and who try to reverse their positions in the minimum possible time, thereby acting as front runners of the reversal process. In the usual course, the trend after such policy meetings is felt reasonably between a few days to a week subsequent to the policy decision, by which time the punters and market makers would have reversed their positions.

Post FOMC meeting, which concluded on October 28, 2015, I have been receiving messages with a lot of scepticism about my previous posts related to USD wherein I had mentioned that USD is expected to go weak against currencies of significance and wherein I had specifically presented charts of USDEUR and USDINR.

To worsen the matter, there are reports on internet, which speak about the near 2% yield on 10 year US treasury, etc. which will keep USD strong. Another report speaks that the Chinese economy is loosening and the devaluation of Yuan will not let USD go weak. Yet another report speaks of the obsolete Phillips curve. I get confused. If I do some more search I will perhaps get some more economic parameters and reasons which will convince the readers that the USD will go stronger. I will further get more confused.

In nutshell, if you combine all these factors mentioned above, you will get something called ‘khichri’, a famous Indian dish offered to sick people suffering from loose motions.

A very dear friend went to the extent of saying, “You are stubborn.”

BUT I AM NEITHER STUBBORN NOR CONVINCED.

Of all the derivatives – commodities, indices and currencies – currencies are the slowest to move. Such a slow movement may cause a range of variations in the opinions of people having interest in predicting currencies either because of exposures or because of profession and at times it is really hard to determine the precise time of change in the trend.

With the objective of substantiating my view, I am presenting a few charts again to clarify or rather magnify my point of view.

USDEUR

The multi-period candlestick chart of USDEUR has made multiple reversal candles and although the close of the last candle has been higher than the close of the previous candle, the entire last candle is formed within the range of the previous candle. This is coupled with a confirmed squeeze about to be completed on the line chart/ graph with adapted Bollinger Bands. This typical squeeze is more of a bearish squeeze rather than a bullish squeeze.


USDINR

The line graphs of Silver and USD with appropriate moving averages for their movement cycle/ momentum and with suitably adapted Bollinger Bands are compared in the following charts. The time periods of the line charts are mentioned thereon. The third chart is the extension of the second line chart.


The middle, upper and lower bands of the USDINR chart have flattened and are now in the early stage of narrowing down, causing to initiate the formation of a squeeze. It is quite possible that the actual USDINR rates continue to remain towards the upper end of the upper band but the process of formation of squeeze will lead the USD to drift lower. This may be gradual or abrupt. It is anybody’s guess.

Best wishes for the festive season.


For any clarifications please feel free to contact.

Contact:
The author can be contacted at riskadvisory@outlook.com

Disclaimer:
These extracts from my trading books are for educational purposes only. Any advice contained therein is provided for the general information of readers and does not have regard to any particular person's investment objectives, financial situation or needs and must not be construed as advice to buy, sell, hold or otherwise deal with any commodities, currencies, securities or other investments. Accordingly, no reader should act on the basis of any information contained therein without first having consulted a suitably qualified financial advisor.

Crude Oil (INR) - WTI Update for Nov 2015

Crude Oil (INR) – WTI – Update for November 2015

Since my last post on Crude Oil – WTI, NDF traded on MCX, India, Crude Oil remained range bound yet quite fluctuative within the range. In the last few sessions of October 2015, Crude Oil showed remarkable recovery and formed yet another reversal candlestick pattern, indicating a probable sideways to upwards movement.


Adapted Bollinger Bands also indicate convergence into formation of a squeeze in the near future. The other technical parameters at the time of completion of squeeze will indicate continuation of the trend or reversal of the trend.


As of now there is no indication of Crude Oil falling below the lows formed during the last month, i.e. Rs.2792.

Baker Hughes U.S. Rig Count reduction to 578 from previously reported 594 will probably keep the rates stable.

Contact:
The author can be contacted at riskadvisory@outlook.com

Disclaimer:

These extracts from my trading books are for educational purposes only. Any advice contained therein is provided for the general information of readers and does not have regard to any particular person's investment objectives, financial situation or needs and must not be construed as advice to buy, sell, hold or otherwise deal with any commodities, currencies, securities or other investments. Accordingly, no reader should act on the basis of any information contained therein without first having consulted a suitably qualified financial advisor.

Friday, 23 October 2015

China Cuts Interest Rate by 0.25 Percentage Points, Effective From Oct. 24

According to the flash news received just now, China is going to cut interest rates by 0.25% effective today, i.e. October 24, 2015. Please see the link given below:

http://www.bloomberg.com/news/articles/2015-10-23/china-cuts-interest-rate-by-0-25-ppt-effective-from-oct-24

This will have no impact on my views published earlier. The links of all my posts are given on the right of this post.

Contact:
The author can be contacted at riskadvisory@outlook.com

Disclaimer:
These extracts from my trading books are for educational purposes only. Any advice contained therein is provided for the general information of readers and does not have regard to any particular person's/ corporation’s investment objectives, financial situation or needs and must not be construed as advice to buy, sell, hold or otherwise deal with any commodities, currencies, securities or other investments. Accordingly, no reader should act on the basis of any information contained therein without first having consulted a suitably qualified financial advisor.