Sunday, 7 February 2016

Year 2015 – End of an Era – The fading away of USA and USD

Year 2015 – End of an Era – The fading away of giants

Year 2015 will mark the end of an era in the chapters of History of World Economics. Two mighty giants – the USA and the PRC (People’s Republic of China) who grew too big for the world economy in their quest for their economic might with combined GDP in the region of USD 25 trillion will be gradually overshadowed by the trailing economies, viz., the Eurozone, BRIC nations minus China, due to slowdown in these two economies.

Well, well, well……..

That is a bold statement to make and who would live that long to make an assessment of the foregoing statement. Yet let me make an attempt to support my statement.

Mistakes of the past

Sometimes the mistakes of the past haunt you so much that they don’t let you go far.
I am referring to the mistakes made by the US and Chinese policy makers. I shall now be taking the specific case of the US economy.

Two wrongs never make a right and US has just done that. Within the last ten years the US has made two wrongs which will be severely punished by the laws of the economics and it will take decades for the US economy to recover from the aftershocks of the financial tsunamis that it has brought to the world. The first one was financial crisis caused by the subprime borrowing. The second one was to hike interest rates at an inappropriate time (it should have done it long back) when the stock markets are in a highly speculative zone. The second financial tsunami is underway and has just begun. The complete wave of the US stock markets correction will determine the extent of the aftermath of the stock markets correction.

The manipulated USD and its consequent impact on the world economy

The USD has been a strong yet manipulated currency since decades which has always benefitted the US economy. A strong economy feeds the currency and vice versa. Both feed each other so much that sometimes the cause and effect relationship is lost. The trend finds its way to glory till the underlying weaknesses emerge publicly.

Why has the US economy grown while the other economies are still struggling to survive or grow at a decent rate?

A strong USD has hurt the growth of the world economy by causing deflation the world over in the commodities market, whereas it has helped consumerism in the US by way of cheaper imports.


The policies of the Fed during the last eight year, led to channelizing of funds of the US economy to a super inflated stock market and a rigged and manipulated currency not having adequate underlying strength. Both, the stock markets and the currency have outlived their real strength. We have already witnessed the bearishness of the US stock markets starting Jan 2016 and the economic data pouring in is also not too healthy.

Turbulent US economy and the USD in times to come

A manipulated strong USD and the flawed policies of the Fed have led to forced consumerism in the US economy by not giving adequate options to the US citizens to save – save for the rainy day.

The trend of the US stock markets and the USD – supported by the flawed policies of the Fed – have forced the world to believe in the paradigm that we have entered into an era of negative or zero interest rates. Perhaps new laws of economics will emerge over a period of time which I, in my personal capacity, cannot imagine at this stage. But I do believe in the fact that the laws of cost of capital will remain intact.

A project cannot be made viable by lowering the cost of capital. A project remains viable by its sheer inherent strength, strong natural demand and its economic NPV or IRR. The stress tests on the variables of a project determine the viability and strength of the project in times of stress and not the variability of the cost of capital.

With a strong and steep correction of the stock markets underway in the US, the US economy and the USD will remain weak until cows come home, because at this juncture the Fed and Uncle Sam are not left with much economic ammunition and options to revive the economy.

A weak dollar coupled with emergence of other stronger economies and currencies will lead to the limited powers of spending of and by the US citizens and Uncle Sam, leading to a decline in the financial might and prowess and consequent lesser strength in the arena of world economics and other geopolitical platforms.

Consequently the USD will remain a turbulent and unmanageable currency in times to come.

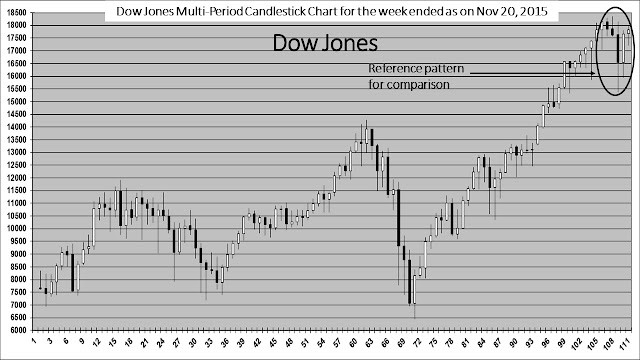
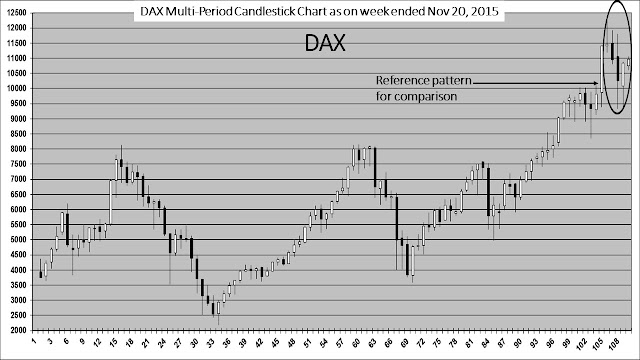
Charts of US stock market and USD


Contact:
The author can be contacted at riskadvisory@outlook.com.

Disclaimer:

The extracts from my trading books are for educational purposes only. No attempt is being made to give any kind of advice to anyone. The contents are for the general information of readers and does not have regard to any particular person's investment objectives, financial situations or needs. Consequently the contents must not be construed as an advice to make investments, sell, hold or otherwise deal in any or a set of currencies, commodities or any other kind of assets. Accordingly, no reader should act on the basis of any information contained therein without first having consulted a suitably qualified financial advisor.

Saturday, 2 January 2016

Crude Oil - WTI (INR and USD) - January 2016

Crude Oil – WTI (INR and USD)

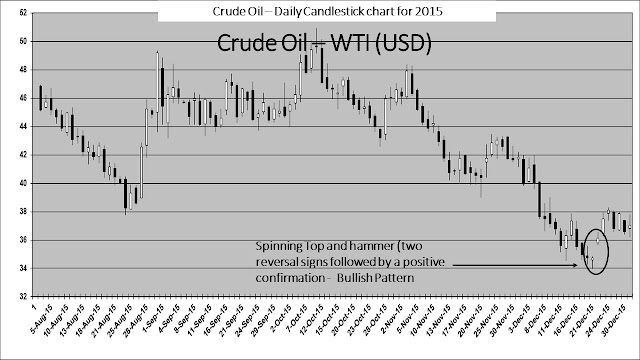
Talks are abuzz that Crude Oil is going to fall further. There is news that there may be far excess supply in 2016 than what the global markets may be able to absorb and that the crude carrying ships are being used as storage capacities and crude is being ferried to the farthest destinations so as to increase the transit time for very well-known reasons.

However the most recent candlestick chart patterns of WTI (INR and USD) have thrown up some surprises. While a few of them have been followed by positive confirmations, a positive confirmation is yet to follow on fortnightly and monthly candlestick charts (INR and USD).

The adapted Bollinger Bands do not yet give any indication of formation of a squeeze and a consequent reversal of trend, yet it seems after combining all the above factors that Crude Oil is in a consolidative phase and at least for now the rates have stabilised.

A bullish phase would be confirmed with the formation of a white candle on the monthly candlestick charts and with the initiation of the formation of a squeeze on adapted Bollinger Bands.


Best wishes for the New Year 2016.

Contact:
The author can be contacted at: riskadvisory@outlook.com.

Disclaimer:
These extracts from my trading books are for educational purposes only. Any advice contained therein is provided for the general information of readers and does not have regard to any particular person's investment objectives, financial situation or needs and must not be construed as advice to buy, sell, hold or otherwise deal with any commodities, currencies, securities or other investments. Accordingly, no reader should act on the basis of any information contained therein without first having consulted a suitably qualified financial advisor.

Saturday, 5 December 2015

Blame It On Fed and ECB

Blame it on Fed and ECB

Since my last post titled “The Final Countdown – Indices Special” on November 21, 2015, two events of significance have occurred, viz.:

·         ECB reduced deposit rates by 0.10% to negative 0.30% and announced QE amounting to 360 billion euros extended till 2017
·         Fed chairperson’s testimony to the US Senate and persistence in view to get off the near zero interest rate tiger in light of robust US economic and jobs data indicating adequate and continued strength in the economy

The spontaneous reaction of the financial markets to ECB’s decisions was clearly visible in the currency and stock markets.

However these events left me in a confused state of mind. The confusion arose on the following accounts:

·         Why is Fed hell bent to raise interest rates on 15th-16th December 2015, when it did not raise it at times when the US economy and the stock markets were doing so well for many years in the recent past?
·         Why does the ECB have to reduce the deposit rates? What was the rationale behind this move to bolster Euro and how effective will be the ECB’s bond buying program of 360 billion euros to strengthen the Euro Zone economy?

NOW I AM CONVINCED THAT:

·         Central Banks do make mistakes and
·         Sometimes Central Banks make mistakes in series by their inaction/ wrong actions at wrong times and
·         They also:
o   Let the blame fall on themselves, and
o   Empower financial markets to prove that the Central Banks act wrong

Listening/ reading about Fed’s/ ECB’s statements, its actions/ inactions and listening to the subsequent commentary of the analysts has finally kicked my spirit this time to interpret these statements and actions.

I will make an attempt to interpret these in my way.


A. Fed’s Decision to raise the interest rates – Biggest Blunder by Fed as far as timing is concerned – Enjoy the roller coaster at FeDisneyland

I admit that the US economy is robust at this moment but the best milestone/ time to have lifted the cap has been left way behind in time; perhaps almost two years and a quarter back in time. Now that the US stock markets/ Indices are at their peak and ripe to show some ‘Correction’, raising interest rates at this juncture will only lead to the blame of ‘Correction’ being put on the Fed. Fed has already sown the thoughts of ‘Correction’ with the markets.

Please read the news article below. This article appeared on Bloomberg’s website:

According to October's FOMC statement, Fed officials believe "it will be appropriate to raise the target range for the federal funds rate when …….."

According to Yellen today, she currently judges that "US economic growth ……2 percent". In short, she believes the conditions for a rate hike have been met.

Declaration came with the usual caveats: It is data dependent and a really bad November payrolls figure
or some other negative shock (perhaps another dip in the stock market like we saw in August) could yet persuade the Fed to hold fire.

"We don't expect ….., so we have to assume that a rate hike is coming", says Capital Economics in a research note.

Beyond the first rate hike, Yellen stressed ………..zero. But frankly that estimate is 90% guesswork.”

My Interpretation

The Fed chairperson has handed over the tool for not lifting the interest rate cap in the hands of the Wall Street.

·         Message for Wall Street: When the option is available, exercise it.

In my opinion the damage is done now. Interest rate cap lift-off could have been deferred


B. ECB’s decision of QE to the tune of 360 billion euros

My Interpretation

No doubt that robust stock markets support the economy. When the stock markets are highly speculative and are due for correction, any quantum (be it “Too little” or adequate) of bond-buying will not lead the stock markets any higher. The effort of bond-buying program will be a waste.

The markets reacted by saying “Too little.” Here also the tool to put the blame on ECB was handed over by ECB itself to the markets.

In my opinion announcement of QE should have been deferred.

There has been no significant change in the graphs presented in my previous post. All my previous views/ stances remain intact.

Best wishes for the festive season.


Contact:
The author can be contacted at: riskadvisory@outlook.com

Disclaimer:

These extracts from my trading books are for educational purposes only. Any advice contained therein is provided for the general information of readers and does not have regard to any particular person's investment objectives, financial situation or needs and must not be construed as advice to buy, sell, hold or otherwise deal with any commodities, currencies, securities or other investments. Accordingly, no reader should act on the basis of any information contained therein without first having consulted a suitably qualified financial advisor.

Saturday, 21 November 2015

The Final Countdown - Indices Special - Nasdaq 100, Nasdaq Composite, Dow Jones, DAX

THE FINAL COUNTDOWN

I am publishing this article a bit ahead of my usual schedule as I find a lot of mismatch in published news articles and what the charts tell me.

What The NEWS says

·         “Fed is all set to lift off the rate cap and Fed has given assurance that the rate increases will be gradual.”
·         “Markets rise to give thumbs up to the Fed’s decision of gradual rate increases.”
·         “In the minutes of the last FOMC meeting, specific phrases/ set of words have been replaced with another set of words, which means that Fed will be compelled to increase the interest rates in the coming December FOMC meeting.”

Such news items I keep reading on various websites and in various articles. Various analysis have been made and aired.

The minutes of the last FOMC meeting are available on the net also. Given below is the link:

Honestly, for me it is tough to interpret the words selectively chosen by Fed and somehow I get a feel that the Fed dances to the tune of the Wall Street to carefully choose the words to convey a message what the Wall Street wishes to listen. So much hype is created around these two events (the FOMC meetings and the release of the minutes) that I sometimes feel that the minutes of the meeting are virtually dictated by the Wall Street through the hype generated through the published news articles.

AND

What the CHARTS foretell

The Final Countdown

I am fascinated by the charts and technical indicators generated by silver. Silver is considered to be one of the most speculative and volatile commodities and the most tough to interpret and follow. Yet I draw a lot of inspiration and references from the various charts of silver and the technical indicators/ parameters generated by the data of silver.

The Markets/ Indices remain bearish

Therefore in my present article I will draw reference from one of the old charts of silver, without drawing any conclusive downward targets and at the same time continuing to maintain my previous stance that the markets are bearish and also that now the ‘Final Countdown’ has begun.

Please note that for the multi-period charts shown below, the completion period is either approximately a week away or about a month and a week away. Though a lot can happen in a week’s/ a month’s time, yet approx. 100 points or so up from here will not at all alter the reference patterns and my stance. Approx. 100 points or more below the current levels will only strengthen my stance. Moreover, during the formation of such reference patterns, the patterns are usually not sustainable for a long period of time and therefore their snapshot picture formation is more important than sustainability of formation.


I do not wish to give targets to my readers (the most common asked question from the readers of my blog), simply because I do not drive the market. Secondly, although the past identical/ similar patterns give a good reference, yet these may or may not yield the similar outcomes/ returns. Thirdly, the art or science of calculation of targets is still a mystery for me. I just simply know that as a thumb rule, previous peaks offer targets or resistances.

Best wishes for the festive season.

Contact:
The author can be contacted at: riskadvisory@outlook.com

Disclaimer:

These extracts from my trading books are for educational purposes only. Any advice contained therein is provided for the general information of readers and does not have regard to any particular person's investment objectives, financial situation or needs and must not be construed as advice to buy, sell, hold or otherwise deal with any commodities, currencies, securities or other investments. Accordingly, no reader should act on the basis of any information contained therein without first having consulted a suitably qualified financial advisor.

Sunday, 1 November 2015

Indices Update - November 2015

Indices Update – November 2015

The next meeting of the Federal Open Market Committee (FOMC) is scheduled for December 15-16, 2015. While there is a lot of hype created around rate hike by Fed, all successive meetings of the FOMC in the past have not been successful in increasing the rates so far despite a long stretch of period of superb data announced for past so many years.

Whatever may have been the set of reasons for the two Fed chairpersons, Mr.Bernanke and Ms.Yellen, for not increasing the interest rates, at various milestones in the past, it will now be increasingly tough for the incumbent chairperson to announce a rate hike in the near future in wake of the slowdown in the US and parts of the global economy.

I continue to maintain my view as mentioned in one of my previous posts that the US stock market indices, DAX and Nifty are at a stage from where the journey is only sideways to downwards. The festive season may bring some cheer to the indices in terms of sales/ consumer spending but that will only be a temporary respite.

Given below are the updated charts of Nifty, Dow Jones, DAX and Shanghai Composite (SSEC) till October 2015.


Best wishes for the festive season.

Contact:
The author can be contacted at riskadvisory@outlook.com

Disclaimer:

These extracts from my trading books are for educational purposes only. Any advice contained therein is provided for the general information of readers and does not have regard to any particular person's/ corporation’s investment objectives, financial situation or needs and must not be construed as advice to buy, sell, hold or otherwise deal with any commodities, currencies, securities or other investments. Accordingly, no reader should act on the basis of any information contained therein without first having consulted a suitably qualified financial advisor.

Gold and Silver Update - November 2015

Gold and Silver

Given below are updated charts of Gold and Silver for the period ended October 2015.

Both the precious metals have formed another reversal pattern on their multi-period candlestick charts.

The line charts (INR) with adapted Bollinger Bands of both the precious metals have formed a squeeze indicating and confirming reversal of the trend indicated on the candlestick charts.


Best wishes for the festive season.

Please feel free to seek any clarification.

Contact:
The author can be contacted at riskadvisory@outlook.com

Disclaimer:
These extracts from my trading books are for educational purposes only. Any advice contained therein is provided for the general information of readers and does not have regard to any particular person's investment objectives, financial situation or needs and must not be construed as advice to buy, sell, hold or otherwise deal with any commodities, currencies, securities or other investments. Accordingly, no reader should act on the basis of any information contained therein without first having consulted a suitably qualified financial advisor.