Saturday 5 December 2015

Blame It On Fed and ECB

Blame it on Fed and ECB

Since my last post titled “The Final Countdown – Indices Special” on November 21, 2015, two events of significance have occurred, viz.:

·         ECB reduced deposit rates by 0.10% to negative 0.30% and announced QE amounting to 360 billion euros extended till 2017
·         Fed chairperson’s testimony to the US Senate and persistence in view to get off the near zero interest rate tiger in light of robust US economic and jobs data indicating adequate and continued strength in the economy

The spontaneous reaction of the financial markets to ECB’s decisions was clearly visible in the currency and stock markets.

However these events left me in a confused state of mind. The confusion arose on the following accounts:

·         Why is Fed hell bent to raise interest rates on 15th-16th December 2015, when it did not raise it at times when the US economy and the stock markets were doing so well for many years in the recent past?
·         Why does the ECB have to reduce the deposit rates? What was the rationale behind this move to bolster Euro and how effective will be the ECB’s bond buying program of 360 billion euros to strengthen the Euro Zone economy?

NOW I AM CONVINCED THAT:

·         Central Banks do make mistakes and
·         Sometimes Central Banks make mistakes in series by their inaction/ wrong actions at wrong times and
·         They also:
o   Let the blame fall on themselves, and
o   Empower financial markets to prove that the Central Banks act wrong

Listening/ reading about Fed’s/ ECB’s statements, its actions/ inactions and listening to the subsequent commentary of the analysts has finally kicked my spirit this time to interpret these statements and actions.

I will make an attempt to interpret these in my way.


A. Fed’s Decision to raise the interest rates – Biggest Blunder by Fed as far as timing is concerned – Enjoy the roller coaster at FeDisneyland

I admit that the US economy is robust at this moment but the best milestone/ time to have lifted the cap has been left way behind in time; perhaps almost two years and a quarter back in time. Now that the US stock markets/ Indices are at their peak and ripe to show some ‘Correction’, raising interest rates at this juncture will only lead to the blame of ‘Correction’ being put on the Fed. Fed has already sown the thoughts of ‘Correction’ with the markets.

Please read the news article below. This article appeared on Bloomberg’s website:

According to October's FOMC statement, Fed officials believe "it will be appropriate to raise the target range for the federal funds rate when …….."

According to Yellen today, she currently judges that "US economic growth ……2 percent". In short, she believes the conditions for a rate hike have been met.

Declaration came with the usual caveats: It is data dependent and a really bad November payrolls figure
or some other negative shock (perhaps another dip in the stock market like we saw in August) could yet persuade the Fed to hold fire.

"We don't expect ….., so we have to assume that a rate hike is coming", says Capital Economics in a research note.

Beyond the first rate hike, Yellen stressed ………..zero. But frankly that estimate is 90% guesswork.”

My Interpretation

The Fed chairperson has handed over the tool for not lifting the interest rate cap in the hands of the Wall Street.

·         Message for Wall Street: When the option is available, exercise it.

In my opinion the damage is done now. Interest rate cap lift-off could have been deferred


B. ECB’s decision of QE to the tune of 360 billion euros

My Interpretation

No doubt that robust stock markets support the economy. When the stock markets are highly speculative and are due for correction, any quantum (be it “Too little” or adequate) of bond-buying will not lead the stock markets any higher. The effort of bond-buying program will be a waste.

The markets reacted by saying “Too little.” Here also the tool to put the blame on ECB was handed over by ECB itself to the markets.

In my opinion announcement of QE should have been deferred.

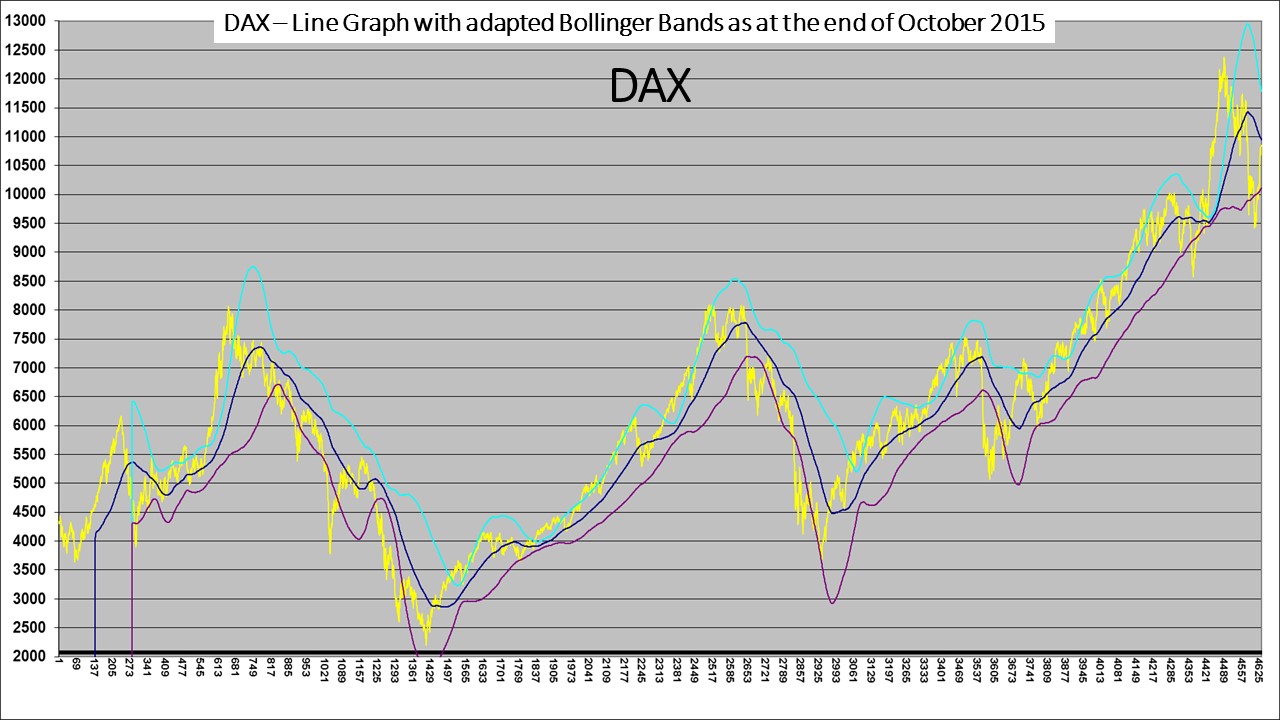
There has been no significant change in the graphs presented in my previous post. All my previous views/ stances remain intact.

Best wishes for the festive season.


Contact:
The author can be contacted at: riskadvisory@outlook.com

Disclaimer:

These extracts from my trading books are for educational purposes only. Any advice contained therein is provided for the general information of readers and does not have regard to any particular person's investment objectives, financial situation or needs and must not be construed as advice to buy, sell, hold or otherwise deal with any commodities, currencies, securities or other investments. Accordingly, no reader should act on the basis of any information contained therein without first having consulted a suitably qualified financial advisor.

Saturday 21 November 2015

The Final Countdown - Indices Special - Nasdaq 100, Nasdaq Composite, Dow Jones, DAX

THE FINAL COUNTDOWN

I am publishing this article a bit ahead of my usual schedule as I find a lot of mismatch in published news articles and what the charts tell me.

What The NEWS says

·         “Fed is all set to lift off the rate cap and Fed has given assurance that the rate increases will be gradual.”
·         “Markets rise to give thumbs up to the Fed’s decision of gradual rate increases.”
·         “In the minutes of the last FOMC meeting, specific phrases/ set of words have been replaced with another set of words, which means that Fed will be compelled to increase the interest rates in the coming December FOMC meeting.”

Such news items I keep reading on various websites and in various articles. Various analysis have been made and aired.

The minutes of the last FOMC meeting are available on the net also. Given below is the link:

Honestly, for me it is tough to interpret the words selectively chosen by Fed and somehow I get a feel that the Fed dances to the tune of the Wall Street to carefully choose the words to convey a message what the Wall Street wishes to listen. So much hype is created around these two events (the FOMC meetings and the release of the minutes) that I sometimes feel that the minutes of the meeting are virtually dictated by the Wall Street through the hype generated through the published news articles.

AND

What the CHARTS foretell

The Final Countdown

I am fascinated by the charts and technical indicators generated by silver. Silver is considered to be one of the most speculative and volatile commodities and the most tough to interpret and follow. Yet I draw a lot of inspiration and references from the various charts of silver and the technical indicators/ parameters generated by the data of silver.

The Markets/ Indices remain bearish

Therefore in my present article I will draw reference from one of the old charts of silver, without drawing any conclusive downward targets and at the same time continuing to maintain my previous stance that the markets are bearish and also that now the ‘Final Countdown’ has begun.

Please note that for the multi-period charts shown below, the completion period is either approximately a week away or about a month and a week away. Though a lot can happen in a week’s/ a month’s time, yet approx. 100 points or so up from here will not at all alter the reference patterns and my stance. Approx. 100 points or more below the current levels will only strengthen my stance. Moreover, during the formation of such reference patterns, the patterns are usually not sustainable for a long period of time and therefore their snapshot picture formation is more important than sustainability of formation.


I do not wish to give targets to my readers (the most common asked question from the readers of my blog), simply because I do not drive the market. Secondly, although the past identical/ similar patterns give a good reference, yet these may or may not yield the similar outcomes/ returns. Thirdly, the art or science of calculation of targets is still a mystery for me. I just simply know that as a thumb rule, previous peaks offer targets or resistances.

Best wishes for the festive season.

Contact:
The author can be contacted at: riskadvisory@outlook.com

Disclaimer:

These extracts from my trading books are for educational purposes only. Any advice contained therein is provided for the general information of readers and does not have regard to any particular person's investment objectives, financial situation or needs and must not be construed as advice to buy, sell, hold or otherwise deal with any commodities, currencies, securities or other investments. Accordingly, no reader should act on the basis of any information contained therein without first having consulted a suitably qualified financial advisor.

Sunday 1 November 2015

Indices Update - November 2015

Indices Update – November 2015

The next meeting of the Federal Open Market Committee (FOMC) is scheduled for December 15-16, 2015. While there is a lot of hype created around rate hike by Fed, all successive meetings of the FOMC in the past have not been successful in increasing the rates so far despite a long stretch of period of superb data announced for past so many years.

Whatever may have been the set of reasons for the two Fed chairpersons, Mr.Bernanke and Ms.Yellen, for not increasing the interest rates, at various milestones in the past, it will now be increasingly tough for the incumbent chairperson to announce a rate hike in the near future in wake of the slowdown in the US and parts of the global economy.

I continue to maintain my view as mentioned in one of my previous posts that the US stock market indices, DAX and Nifty are at a stage from where the journey is only sideways to downwards. The festive season may bring some cheer to the indices in terms of sales/ consumer spending but that will only be a temporary respite.

Given below are the updated charts of Nifty, Dow Jones, DAX and Shanghai Composite (SSEC) till October 2015.


Best wishes for the festive season.

Contact:
The author can be contacted at riskadvisory@outlook.com

Disclaimer:

These extracts from my trading books are for educational purposes only. Any advice contained therein is provided for the general information of readers and does not have regard to any particular person's/ corporation’s investment objectives, financial situation or needs and must not be construed as advice to buy, sell, hold or otherwise deal with any commodities, currencies, securities or other investments. Accordingly, no reader should act on the basis of any information contained therein without first having consulted a suitably qualified financial advisor.

Gold and Silver Update - November 2015

Gold and Silver

Given below are updated charts of Gold and Silver for the period ended October 2015.

Both the precious metals have formed another reversal pattern on their multi-period candlestick charts.

The line charts (INR) with adapted Bollinger Bands of both the precious metals have formed a squeeze indicating and confirming reversal of the trend indicated on the candlestick charts.


Best wishes for the festive season.

Please feel free to seek any clarification.

Contact:
The author can be contacted at riskadvisory@outlook.com

Disclaimer:
These extracts from my trading books are for educational purposes only. Any advice contained therein is provided for the general information of readers and does not have regard to any particular person's investment objectives, financial situation or needs and must not be construed as advice to buy, sell, hold or otherwise deal with any commodities, currencies, securities or other investments. Accordingly, no reader should act on the basis of any information contained therein without first having consulted a suitably qualified financial advisor.

Saturday 31 October 2015

USDEUR and USDINR - Update - November 2015

USDEUR and USDINR

With the conclusion of the recent FOMC meeting and release of its policy decisions on October 28th at 2:00 p.m. US time, which coincides with 11:30 p.m. IST, the USD immediately became volatile and strong against EUR and the strength of USD also reflected against the INR the following day. Such sudden and knee jerk reactions are normally precursors and a confirmatory signal to the change of trends. The knee jerk reactions are a sign of reversal of positions by punters and market makers who have large exposures and who try to reverse their positions in the minimum possible time, thereby acting as front runners of the reversal process. In the usual course, the trend after such policy meetings is felt reasonably between a few days to a week subsequent to the policy decision, by which time the punters and market makers would have reversed their positions.

Post FOMC meeting, which concluded on October 28, 2015, I have been receiving messages with a lot of scepticism about my previous posts related to USD wherein I had mentioned that USD is expected to go weak against currencies of significance and wherein I had specifically presented charts of USDEUR and USDINR.

To worsen the matter, there are reports on internet, which speak about the near 2% yield on 10 year US treasury, etc. which will keep USD strong. Another report speaks that the Chinese economy is loosening and the devaluation of Yuan will not let USD go weak. Yet another report speaks of the obsolete Phillips curve. I get confused. If I do some more search I will perhaps get some more economic parameters and reasons which will convince the readers that the USD will go stronger. I will further get more confused.

In nutshell, if you combine all these factors mentioned above, you will get something called ‘khichri’, a famous Indian dish offered to sick people suffering from loose motions.

A very dear friend went to the extent of saying, “You are stubborn.”

BUT I AM NEITHER STUBBORN NOR CONVINCED.

Of all the derivatives – commodities, indices and currencies – currencies are the slowest to move. Such a slow movement may cause a range of variations in the opinions of people having interest in predicting currencies either because of exposures or because of profession and at times it is really hard to determine the precise time of change in the trend.

With the objective of substantiating my view, I am presenting a few charts again to clarify or rather magnify my point of view.

USDEUR

The multi-period candlestick chart of USDEUR has made multiple reversal candles and although the close of the last candle has been higher than the close of the previous candle, the entire last candle is formed within the range of the previous candle. This is coupled with a confirmed squeeze about to be completed on the line chart/ graph with adapted Bollinger Bands. This typical squeeze is more of a bearish squeeze rather than a bullish squeeze.


USDINR

The line graphs of Silver and USD with appropriate moving averages for their movement cycle/ momentum and with suitably adapted Bollinger Bands are compared in the following charts. The time periods of the line charts are mentioned thereon. The third chart is the extension of the second line chart.


The middle, upper and lower bands of the USDINR chart have flattened and are now in the early stage of narrowing down, causing to initiate the formation of a squeeze. It is quite possible that the actual USDINR rates continue to remain towards the upper end of the upper band but the process of formation of squeeze will lead the USD to drift lower. This may be gradual or abrupt. It is anybody’s guess.

Best wishes for the festive season.


For any clarifications please feel free to contact.

Contact:
The author can be contacted at riskadvisory@outlook.com

Disclaimer:
These extracts from my trading books are for educational purposes only. Any advice contained therein is provided for the general information of readers and does not have regard to any particular person's investment objectives, financial situation or needs and must not be construed as advice to buy, sell, hold or otherwise deal with any commodities, currencies, securities or other investments. Accordingly, no reader should act on the basis of any information contained therein without first having consulted a suitably qualified financial advisor.

Crude Oil (INR) - WTI Update for Nov 2015

Crude Oil (INR) – WTI – Update for November 2015

Since my last post on Crude Oil – WTI, NDF traded on MCX, India, Crude Oil remained range bound yet quite fluctuative within the range. In the last few sessions of October 2015, Crude Oil showed remarkable recovery and formed yet another reversal candlestick pattern, indicating a probable sideways to upwards movement.


Adapted Bollinger Bands also indicate convergence into formation of a squeeze in the near future. The other technical parameters at the time of completion of squeeze will indicate continuation of the trend or reversal of the trend.


As of now there is no indication of Crude Oil falling below the lows formed during the last month, i.e. Rs.2792.

Baker Hughes U.S. Rig Count reduction to 578 from previously reported 594 will probably keep the rates stable.

Contact:
The author can be contacted at riskadvisory@outlook.com

Disclaimer:

These extracts from my trading books are for educational purposes only. Any advice contained therein is provided for the general information of readers and does not have regard to any particular person's investment objectives, financial situation or needs and must not be construed as advice to buy, sell, hold or otherwise deal with any commodities, currencies, securities or other investments. Accordingly, no reader should act on the basis of any information contained therein without first having consulted a suitably qualified financial advisor.

Friday 23 October 2015

China Cuts Interest Rate by 0.25 Percentage Points, Effective From Oct. 24

According to the flash news received just now, China is going to cut interest rates by 0.25% effective today, i.e. October 24, 2015. Please see the link given below:

http://www.bloomberg.com/news/articles/2015-10-23/china-cuts-interest-rate-by-0-25-ppt-effective-from-oct-24

This will have no impact on my views published earlier. The links of all my posts are given on the right of this post.

Contact:
The author can be contacted at riskadvisory@outlook.com

Disclaimer:
These extracts from my trading books are for educational purposes only. Any advice contained therein is provided for the general information of readers and does not have regard to any particular person's/ corporation’s investment objectives, financial situation or needs and must not be construed as advice to buy, sell, hold or otherwise deal with any commodities, currencies, securities or other investments. Accordingly, no reader should act on the basis of any information contained therein without first having consulted a suitably qualified financial advisor.


Friday 16 October 2015

The SOS Call

The panic situation

A few years back, late evening I received a phone call from an employee of MF Global Dubai, whom I had been in touch with through an NRI acquaintance.

The guy was a Punjabi, working in Dubai and during the call, he spoke with me in the native language as if we were long lost friends. I really felt nice. This phone call was out of the blue and I thought to myself how good and humane this guy was. After speaking for about 10-15 minutes in a freewheeling conversation wherein I could not figure out the purpose of his call, he finally broke the ice and insisted that I open an account with them and also recommend a few more clients who could possibly open their accounts with MF Global.

I humbly told him that I was governed by the RBI rules and it wasn’t possible for me to open an account with them and also that I didn’t know of any other NRI who could do so.

A week to ten days later the news of MF Global going bankrupt became public.

Such desperate, out of the blue calls to persuade new customers to open fresh accounts to infuse liquidity in the company/ system are sure shot signs of panic in the system. This is akin to the Ponzi/ Chit fund schemes which overspend or which invest/ divert the members’ funds unscrupulously in the hope of sustenance out of future subscriptions from the existing members or fresh injection of funds by the future new members. Till the time the money keeps flowing in everything is hunky-dory but the first sign of liquidity problems triggers such kind of panic reactions from these brokerages or schemes to generate fresh funds by inducting new members. Unfortunately by that time the party is generally over and people are returning home.

The Big investment Bowl of Banks

Every time I visit the bank to deposit a cheque or for any other reason, I am met by the ever smiling relationship manager, only with a difference now. She spends more time with me and tries to persuade me to invest in the newly launched investment schemes of the bank with various options available and mind you, with full capital protection. I do not read the fine print because I generally do not carry my reading glasses with me to the bank. When she speaks with confidence about the booming stock market of India and the world, and that India is more resilient in comparison to the global stock markets, she is filled with pride towards her motherland. With such a positive attitude she gives me an inferiority complex and makes me think twice about what I am about to write.

Chinese Ponzi Scheme v/s Fed’s Casino and their impact on respective Indices – Which will beat the other in terms of speed of fall?

Enter Las Vegas and you are offered free coupons to start playing in a casino along with free liquor and free food. If you put in your money on stake and if you go bankrupt – and the chances are very bright that you would – you are given a free drop home. That’s what I have been told about the casinos in Las Vegas.

We have already seen the speed of the fall of the Shanghai Composite in the recent past. It is now a matter of time to see how long the Dow Jones can sustain itself and how speedier will be its fall. Will it be speedier in comparison to the fall of the Shanghai Composite or much slower?

Why would it fall? That is what anyone would ask.

Very simple and elementary. What China did to its economy for past two decades, the US did it in the past 7-8 years. Only the modus operandi was different.

China kept funding the losses of State run enterprises which flooded across the globe, billions and billions of units of cheap goods at below cost price to attract FDI from across the globe. This is nothing but a Ponzi scheme run at the level of a State. Alas we do not have a UN Council of Ponzi and Casino to check such Ponzi Schemes. Even if we had one, I can bet that despite all push and pull, India would not have got a seat there and would have got vetoed.

The US through Fed, gave away free capital through a series of QEs (somewhat like the zero interest EMI schemes of Indian retailers to push the sales of Apple iphones designed in the USA and made in China – subsequently banned by the RBI a few years back; perhaps RBI realises it well that there is no free lunch) to absorb the prior generation bad debts and the losses in the system in one stroke after the collapse (I am just discussing the concept and not discussing the nitty gritty of the Fed schemes) to smoothen the lives of the millions of Americans.

So while the Ponzi Scheme of China is yet under the wraps and covers and has manifested itself by way of crash of the Shanghai Composite, the fallout of the Fed’s casino, played publicly over the table, is yet to manifest itself by its impact on the US stock indices. Both the schemes did well in terms of creating substantial public and global interest.

The Chinese Ponzi scheme was born out of the ambition and greed to kill the global competition and be a supreme economic power whereas the Fed’s Casinos was born out of the fear of sustenance.

The Ponzi scheme did not realise that the scheme will make the adjoining and competing countries more healthy and fit for competition. If I can reliably get my food and daily amenities at half the cost and in time, I would rather focus my energies on something more creative in life and create more competitive advantages for myself.

In the game of Fed’s casino, fresh bets were placed to cover the losses arising out of the bets of a previous game. The Fed’s casino did not realise that the capital will flow to the point of maximum returns across the globe (may kindly be read as the point of riskier returns) without thinking twice as to what if a similar fate strikes the US economy again as it did in the year 2008. What will the Fed do then? Open a fresh QE front (aka new casino) before winding up the previous one to start a new chapter or….? May be the Fed can shed some light on it.

The above two State run schemes give me nightmares when I think of ecommerce companies like Amazon India, Flipkart, Paytm, Shopclues, et al, which work on the concept of GMV (Gross Market Value) and offer deep discounts to acquire customers. And as if the things were not bad enough for these companies, Alibaba (aur chalees chor) is ready to jump in the bandwagon in the quest of making more losses. Are we not running a legalised Ponzi scheme here? They are selling the products and writing a cheque too! Who will finally pay for the losses of these giants (remember that there is no free lunch), who in their greed to become dominant players in the ecommerce market of future are burning cash today?

Meanwhile here are the updated multi-period candlestick and line charts of the key stock market indices as at the end of the first fortnight of October 2015.


The multi-period candlestick charts are not yet complete for the multi-period, however the not yet complete charts have no impact on the analysis given below.

I do not wish to sound negative but somehow I find it tough to speak the euphemistic language of most of the market analysts simply because I am not familiar with the jargon. These charts are important because I personally feel that the global stock markets will not be able to sustain for long and the fall is inevitable. I maintain my stance that the markets remain bearish with intermediate pull backs irrespective of whether there is an interest rate hike by the Fed or not, whether there is a QE going to be announced by China or not, whether there is an announcement of a fresh Ponzi scheme or a new casino in the global arena.

A Caveat

The pull backs mentioned in the foregoing paragraph might be momentous and might give an impression of a full blown bullish wave though I assign a very low probability of occurrence of such pull backs.

Best wishes.

Links to my previous posts:
Contact:
The author can be contacted at riskadvisory@outlook.com

Disclaimer:

These extracts from my trading books are for educational purposes only. Any advice contained therein is provided for the general information of readers and does not have regard to any particular person's/ corporation’s investment objectives, financial situation or needs and must not be construed as advice to buy, sell, hold or otherwise deal with any commodities, currencies, securities or other investments. Accordingly, no reader should act on the basis of any information contained therein without first having consulted a suitably qualified financial advisor.

Sunday 4 October 2015

Gold and Silver poised for Vertical Charlie

Has the Wall Street finally given up on the economic recovery?

During the period 2008 till now, the US Central Bank framed economic policies that systematically channelized the funds of the US economy towards the stock markets by creating an environment of:
a) zero or near zero interest rates
b) more than adequate liquidity in the entire US and global economy focused towards creation of capital and generation of employment (knowing very well that the recovery of the US economy is dependent upon the general overall progress and recovery of the global economy)
c) restoration of consumer confidence in the economy for putting consumer spending back on track
d) inflation target of 2% (which could never be achieved – perhaps the only indicator which indicates that the anomalies in the US market still exist and the growth has occurred in a highly skewed manner only in select geographical pockets and the distribution of the benefits of such growth are equally skewed and uneven)

It was beneficial for the largest economy of the world (in terms of consumption and GDP) to have a strong domestic currency, i.e., USD, to have low cost imports for the consumers to get out of the depression spiral as soon as possible. That perhaps explains for the stronger dollar against majority of the global currencies (Please refer to my blog: What will happen to the US Dollar after this? http://commoditycurry.blogspot.in/2015/09/what-is-going-to-happen-to-usd-after.html)

The US economy having reached the peak of the (so claimed) recovery which henceforth seems to unsustainable at the historic rates and with inflation target not having been met, it now makes sense for the Fed to depreciate the currency and eventually fall in line with the global secular trend. After all no economy or central bank can control or influence the world economy or afford to do so for so long (nearly a decade) with its policies and words.

Gold and Silver
Gold and silver are poised for a vertical take-off, in the era of beginning of a faltering US economic recovery, zero interest rates nearing an end and a weakening USD.

Here are the charts of Gold and Silver. My comments are given on the charts


Here is the link to my previous posts/ blogs:

Contact:
The author can be contacted at riskadvisory@outlook.com

Disclaimer:
These extracts from my trading books are for educational purposes only. Any advice contained therein is provided for the general information of readers and does not have regard to any particular person's/ corporation’s investment objectives, financial situation or needs and must not be construed as advice to buy, sell, hold or otherwise deal with any commodities, currencies, securities or other investments. Accordingly, no reader should act on the basis of any information contained therein without first having consulted a suitably qualified financial advisor.