Wednesday 16 September 2015

United we Fall Divided we Stand

United Colours of Global Stock Markets

Based upon a tremendous response from the readers of my blogs and their specific queries, I am encouraged to post the updates much earlier than my scheduled interval so as to give them a better and informed perspective on the stock markets with specific reference to Nifty.

Normally these predictive and forward looking statements are available for a charge. However, it is imperative to give clarification to the general public related to my previous blogs, because a majority of the public does not have means and tools to make an informed analysis of the data and the news and it usually gets carried away by the hopes and sentiments of the street.

By my past experiences, I have learnt that it is the first wave which determines the onset of a trend. Even after the initiation of the first wave an ordinary investor (generally a bullish investor) is always hopeful that the market will touch its previous highs and will also perhaps cross them (assuring himself – this time it will be different, without knowing the truth that each time it is the same). It is the greed which plays here. The emotions come into play but if you need to be in the stock markets, like any other business you need to cut your losses by being unemotional.

By the time the second bearish wave sets in, the mix of fear and hope sets in. Now it is a balanced mix of fear and greed which comes into play. “What if the stocks fall further; what if I sell now and the markets bounce back; no I don’t think markets will plunge further.”

By the time the third wave sets in, it is predominantly the fear which acts now (What if the stocks fall further) and the combined fear of all the ordinary investors makes the third wave. This can be an extended or a short wave. The duration of the wave may or may not match the multi-period candlestick patterns/ charts that I may display in this post of mine.

Keeping the above facts in mind, I will make an attempt to project what I expect to happen in the stock markets, with specific reference to Nifty. Though we are talking about the stock market index, for the ease of understanding, I will be using the graph of EURINR with adapted Bollinger Bands.

Nifty made first bearish signal on the weekly candlestick charts for the week ended on 05 March, 2015. This was followed by bearish fortnightly and multi-period candlestick chart signals and confirmations.


Therefore assuming that Nifty is not bearish and being hopeful that it will recover and overshoot its previous highs is certainly neither right nor possible despite whatever promises or hopes any analyst or fund manager may give 
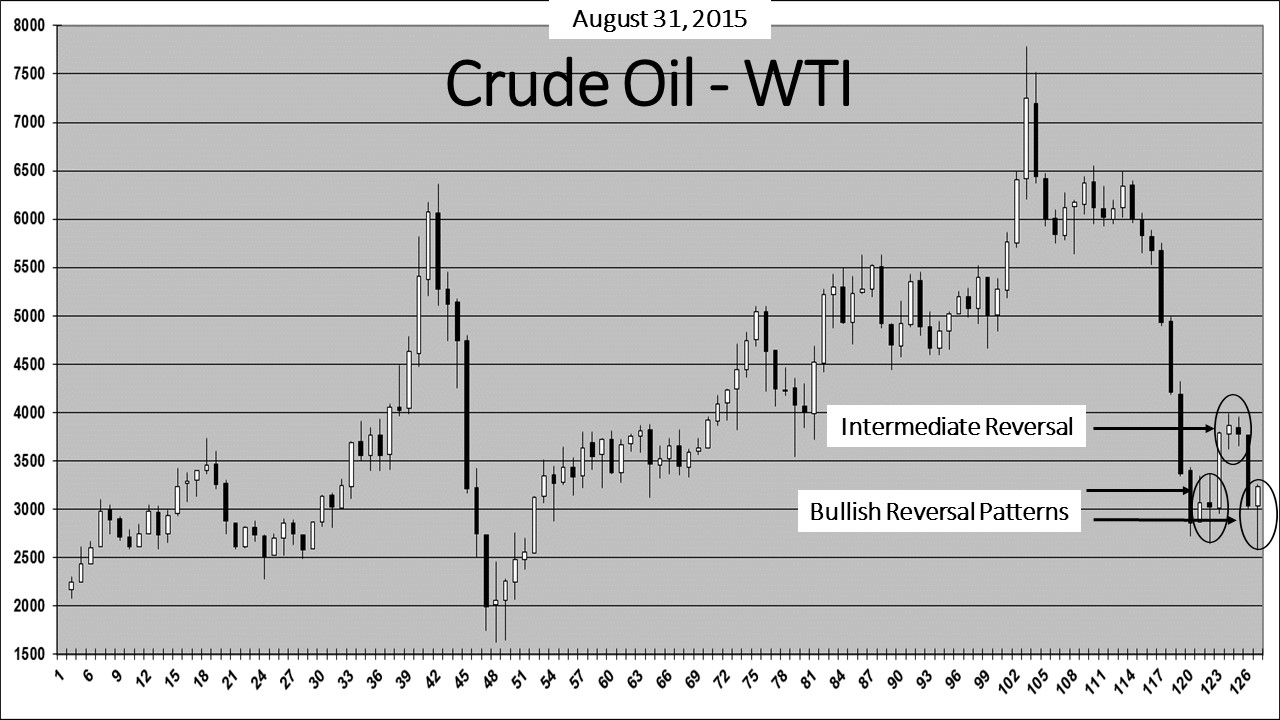
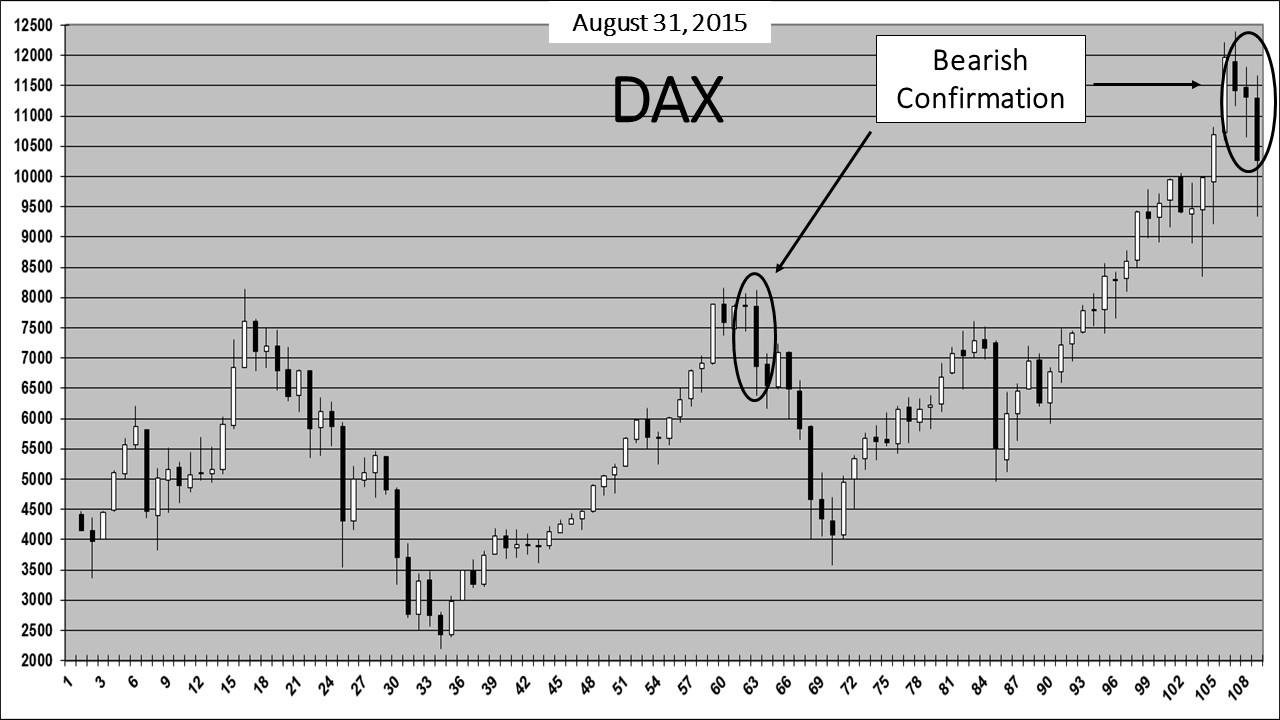
to the investing public. Please see the charts. Nifty has already made one complete wave of bearishness. Bearishness in Nifty started almost a month earlier than it happened in Dow and DAX, though both Dow and DAX and respective technical indicators had given adequate warnings/ signals of the start of the bear phase. A 0.25% rate increase or no increase by FED will make no impact on Dow or DAX. The markets have already determined their course – downwards with small intermediate pull backs.

Intermediate (two – three fortnights) projections for Nifty

Nifty has made a pattern on the fortnightly candlestick charts indicating intermediate pull back/ reversal (calling it bullish will be inappropriate). I expect the market to move sideways to upwards atleast till October end.

Down below is the comparison of Nifty current graph with the graph of EURINR of the past.

Comparison of Nifty Line Graph with that of EURINR.


Here is the link to all my previous posts, which will serve as a good reference to this post of mine.


Please await my post on Gold and Silver.

Best wishes.

Contact:
The author can be contacted at riskadvisory@outlook.com

Disclaimer:
These extracts from my trading books are for educational purposes only. Any advice contained therein is provided for the general information of readers and does not have regard to any particular person's investment objectives, financial situation or needs and must not be construed as advice to buy, sell, hold or otherwise deal with any commodities, currencies, securities or other investments. Accordingly, no reader should act on the basis of any information contained therein without first having consulted a suitably qualified financial advisor.

Friday 11 September 2015

What is going to happen to the USD after this?

What is going to happen to the USD after this?

Imagine what will happen if the USD takes a plunge against all the major currencies of the world. The immediate reaction of most of you will be:
  • Not possible


·  Not exactly. Till a year back many of us were used to thinking that the international (Brent/ WTI) crude oil prices cannot go below a certain rate because it is unviable for producers to produce below that rate. In fact, the production of Crude Oil as of now is far in excess of demand and the prices have dipped. The production still remains unabated because the producers are now weighing how much losses would they incur by not producing vis-à-vis by continuing to produce oil.

Sometimes we are unable to see the unforeseen because of lack of our past experiences.

What if USD actually goes weak?
I can think of two possible outcomes of greater significance:
  •        The USD denominated debt of most of the countries in their local currencies will get reduced – A welcome outcome
  •      Theoretically, if the exchange rate of USD goes below the cost price of the reserves of the Central Bank of a particular country, you can expect the country/ Central Bank to sell the USD reserves and buy stronger currency (instead of being saddled with losses) and the USD rate will further go in the tail-spin – A situation somewhat similar to that of the crude oil discussed above but with different reasons

This is how most of the financial markets work and though it may sound impractical it may actually happen in real life. We have in any case seen the live case of Crude Oil.

Coming to a Billion Rupee question: What is the worth of a USD? Do we have a formula to calculate the value of USD? What is the real exchange rate of USDEUR or USDINR?

Simply put, the real and absolute exchange rate of a currency cannot be determined. There is possibly no single econometric or statistical model/ method which can determine an accurate exchange rate between two currencies. All exchange rates are relative.

To make things simpler for readers, I will take an example of the stock price of a company/ firm. The stock price of a company/ firm always keeps changing and is a function of a host of factors, including but not limited to the:
  •          Value of the company
  •          Outstanding nos. of ordinary stock
  •          Growth rate of EBIDTA/ Earnings/ EPS
  •          Reserves and Outstanding debt, etc., and
  •          An element of speculation

If the company/ firm issues ordinary stock far in excess of the current outstanding stock, the stock price of the company reduces proportionately to the excess stock issued.

Similarly, the value of a currency is also always relative to itself (over a span of time – short/ medium/ long) and to other currencies and is a function of a host of factors, including but not limited to the:
  • GDP of the country
  • Amount of currency in circulation in domestic and international markets
  • Growth rate of the GDP of the country
  • Trade data and dynamics (surpluses and deficits) with its trade partners
  • Forex reserves holdings, outstanding National Debt, etc., and of course
  • An element of speculation

Personally, for me it is tough to understand how a country (I am referring to the US) which had been printing more currency year after year for last so many years (under QE); with its Central Bank’s balance sheet size exceeding US$ 4 trillion from a balance sheet size of US$ 1 trillion 7-8 years back (no doubt with an increasing GDP), can have its currency’s value going up phenomenally against all the currencies of the world. Either the other countries are doing too badly or the US is doing exceedingly well. Everything is relative.

Or perhaps, because everything is relative and the fact that there is no true measure to find the worth of a currency, a greater degree of element of speculation comes in play to systematically rig a currency.
Please see the fresh link posted in the comments section.

My intent here is not to invoke any discussion regarding a statistical/ econometric/ mathematical formula (to reveal the secret – I am poor in statistics) to calculate the worth of USD, but to have a critical view about the worth of USD against currencies of significance and where is USD headed for in the near future in light of the example given above about the stock price of a company.

Here are two charts that I want your attention to be drawn to and these charts are worth examining closely:

USDINR graph – May 01, 2011 - Sep 10, 2015


Silver Graph – Jul 01, 2010 - Sep 20, 2011


Legends:
Yellow line – Actual data values
Middle line – Moving average suitably chosen as per the cycle of the commodity/ currency
Upper/ Lower Band – Adapted from Bollinger Bands

If the latest graph of USD is mirroring somewhat like that of silver in the past, don’t you think it is worth considering as to WHAT HAPPENED TO SILVER graph if it were extended in time. That will perhaps unveil the secret to the Billion Rupee question posed above: “What is the true worth of the USD?”

Here’s What Happened to Silver
Silver Line Graph – July 01, 2010 to Sep 30, 2011


I will leave you all with these thoughts:
  • Will a 0.25% rate hike by FED make the USD much stronger?
  • Will a 0.25% rate hike by FED impact the profitability of the US Companies so much that the US markets will fall?
  • Will a 0.25% rate hike by FED will lead to all the US Dollars in the world march towards the USA, leaving all the local currencies high and dry?

Alternatively:
  • If a 0.25% rate hike is deferred by FED, would it take the US markets to the previous highs?
  • Will a 0.25% rate hike deferment by FED lead to the USD being weaker?

Perhaps none of this will happen. Perhaps all the factors are in-built in the rate of the USD or perhaps none of them is in-built if the governing factors of the value of the USD are entirely different from what I have discussed elsewhere in this post. Perhaps a FED hike of 0.25% rate is an over-hyped event which is not of any significance but probably a great reason to be advanced by the punters of the stock markets or the currency markets to generate turbulence. Perhaps we have crowded our minds with all sort of questions which have no relevance to what is bound to happen to the US markets and the USD.

Perhaps the chart of silver shown above can decipher the track of the USD.

We will all perhaps come to realise this in a very short span of time.

Contact
The author can be contacted at riskadvisory@outlook.com

Disclaimer:

These extracts from my trading books are for educational purposes only. Any advice contained therein is provided for the general information of readers and does not have regard to any particular person's/ corporation’s investment objectives, financial situation or needs and must not be construed as advice to buy, sell, hold or otherwise deal with any commodities, currencies, securities or other investments. Accordingly, no reader should act on the basis of any information contained therein without first having consulted a suitably qualified financial advisor.

Thursday 3 September 2015

NIfty headed for.....

Nifty is headed for 6200 by Jan 2016. There will be an intermediate pull back. Post hitting 6200 there may be an extended bearish phase on account of troubles brewing in the Chinese economy.

Wednesday 2 September 2015

What do Shanghai Composite and Silver have in common? Please read on……

What do Shanghai Composite and Silver have in common? Please read on……

Shanghai Composite’s (the most talked about index these days and which has given jitters to the global stock markets in the fortnight gone by) latest weekly candlestick chart has mirrored somewhat similar to the daily candlestick chart of silver during the first four months of year 2011 (Jan 2011 to Apr 2011). The rise and fall of both has been equally dramatic.

The worst part of the story is that since May 1, 2011, silver has been in the grip of the bears.


At the time when silver fell, increase in margin on silver to almost 25% from the pre-implosion margin of 5% to curb any kind of volatility turned out to be futile. Silver subsequently continuously drifted downwards with periodic sporadic spikes.

What is bound to happen to Chinese stock market or the Chinese economy is anybody’s guess. Perhaps the Chinese premier or the minister of finance may also not know.

The question, whether the chart of silver will serve to be a good reference point to take cue from as to what is about to happen to the Chinese Economy and its consequent impact on the world economy for the next 5-6 years only gives one Goosebumps rather than give a concrete reference.

The two decades of growth of the Chinese economy and the recent crash will definitely serve to be the case study material in the annals of the world economy and the economic history.

The damage caused to the US, European and Chinese stock markets was much more in comparison to the Indian stock markets so far. But assuming that the Indian economy is performing better and is insulated from the global markets or shocks is like living in a fool’s paradise. Sooner or later Nifty and Sensex will catch up with the global markets/ indices.

Currencies

The game of see-saw between Euro & USD and the tailspin of the Indian Rupee (INR)

It is said that when the elephants fight it is the grass which suffers. The see-saw game happening between the Euro and the USD led to rupee falling against the both. The strength of Euro against USD was more damaging for the INR. But does that mean that INR will keep getting weaker endlessly.

The answer is a big NO. The weakening of the INR against the USD and Euro was caused because of the following reasons:
1.       Sudden and unexpected devaluation of Yuan
2.       Speculation and short covering
3.       Weakening of the USD against the Euro


USD/Euro multi-period candlestick chart has formed three reversal patterns. USD is in a confirmed bearish phase against the Euro. The recent strength of USD against Euro in the last week/ fortnight is only intermediate in nature.

My view on the INR against the USD is as follows: USD will weaken against the INR. Exact time of reversal, considering the present turmoil in the global financial markets, cannot be pinpointed. However, we are very close to a reversal.


Any long position in USD against the imports or long-term liabilities can only prove to be suicidal because of weakening of USD. It will be prudent to hedge the liabilities by taking a long position in Euro.

Yuan Devaluation

During the fortnight gone by the currency markets were taken unawares by the sudden and unexpected devaluation of Yuan against the USD. USD by itself had gone weaker against the Euro. Devaluation of the Yuan and subsequent reduction of interest rates by People’s Bank of China (PBC) was a knee-jerk reaction to the falling stock market and faltering economy of People’s Republic of China.

Crude Oil

Crude Oil (Western Texas Intermediate (WTI) / Light Sweet Crude Oil) has made a bullish candlestick pattern on the multi-period candlestick chart. Crude will remain bullish on account of the following:

1.       Intermediate pull back in the stock markets (positive correlation with the stock markets)
2.       Positive inventory reports
3.       Weaker USD
4.       Late night news about the concern amongst the OPEC members about low Crude prices

The above factors are expected to contribute to an upward to sideways movement of the Crude Oil for the next one to two months.


Re-alignment of currencies

The world economic order for the next 7-8 years may lead to the emergence of stronger currencies than USD or Euro. The falling growth rates of PRC will have a huge impact on the economies of the US and the Euro zone and the neighbouring countries of PRC.

http://www.bloombergview.com/articles/2015-12-01/china-invites-booms-and-busts-with-yuan-as-reserve-currency *
* Comment inserted on Dec 02, 2015

Stock Markets

The Primary trend of the stock markets remains downwards. The intermediate correction in this downtrend will take the stock markets in a positive territory. Any upside in the stock markets should be used to exit the long positions or create new short positions.


Opportunities

Close monitoring of the indices and currency derivatives in fluctuating and volatile markets can present opportunities of paradigm shift. The hitherto crossing of the unchartered territories by the markets during the last 7-8 years have led the global markets to the edge of future unchartered territories.

The provision of free capital by the Fed and the US banks led to a kind of embrace of socialism by the largest capitalistic society of the world.

May be the next 7-8 years present more opportunities to PRC to move towards capitalism from presently being a communist country.

Disclaimer:

These extracts from my trading books are for educational purposes only. Any advice contained therein is provided for the general information of readers and does not have regard to any particular person's investment objectives, financial situation or needs and must not be construed as advice to buy, sell, hold or otherwise deal with any commodities, currencies, securities or other investments. Accordingly, no reader should act on the basis of any information contained therein without first having consulted a suitably qualified financial advisor.

Contact:
The author can be contacted at riskadvisory@outlook.com