Wednesday 6 December 2017

Bearish NIFTY

I always say that the stock markets are always the same. This time they are a bit different in a limited sense only. But surely whenever they fall, they leave investors with the same emotions each time.

This time the stock markets are different because of some of the factors listed below:

a)    There is a huge liquidity in the market caused by domestic inflows of mutual funds (which is there every time) but this time the figures are being rolled out - something like a specific feature/ technology of a product being used as a USP for selling it.
b)    The general investors are so optimistic about the bullishness of the markets that they have stopped believing that the markets will ever fall. The S shaped cycle models have been successfully deleted out of the mind and memory of the investors and from the books of economics and marketing. Instead the disruptive valuation models are masking the true state of affairs of the markets and economies world over. The PE ratios and growth rates have lost their relevance or are at an acceptable stretched levels as per the newer norms of the global economies.
c)    The markets have been moving and inching up gradually. Each dip in the past has led to a bounce back higher than the previous highs and the markets have moved on thus.
d)    Every investor is upbeat about the mutual funds keeping the markets afloat and each mutual fund investor has become savvy about investment jargons like SIP and STP. Honestly there may be a few more that I am not familiar with.
e)    Factors like geo-political and economic tensions in Asia (North Korea and South China Sea), Middle East (ISIS and attacks in Syria) and Europe (potential financial default by Greece, annexation of Crimea), just to name a few have been ignored by the stock markets or speaking in a reverse sense, the stock markets and fund managers have never let these events affect the markets. Any negative news on the stock markets has been effectively managed by the media/ respective governments.

This time the paanwalas will not be given the privilege to determine the time of fall of the stocks. It is a general saying in the stock market circles that when the paanwalas start giving stock tips to their customers, it is time to exit the markets.

But this time around, the growth story of India is being attributed to two recently undertaken initiatives of demonetisation and GST by the government. These initiatives will definitely turn in positive results for the economy in times to come, but labelling these initiatives as USPs for the growth story is something which is a matter of concern. These measures will bring in improved transparency, good governance and gradual alignment of the unorganised sector/ parallel economy with the mainstream economy.

If vague factors like Digital India/ Start-ups, demonetisation, GST and may be a few more can be termed as the key differentiators of the growth story of India, probably there could be as many other vague factors/ triggers for the bearishness of the Indian indices.

However, there are a few factors which cannot be afforded to be ignored:

1.    Month after month, the foreign money is being pulled out of the Indian stock markets in big quantum. One gets to hear arguments that the Indian mutual funds (please refer to point no. d) above) are pouring in thousands of crores of money into the stock markets.

We are by any standards still very small in comparison to the amount of money invested in India by the Foreign Institutional Investors (FIIs).

2.    A highly probable rupee strengthening (media and news reports speak of contrary) can shave off extra margins from the export earnings of the industry. The software giants may see a straight impact on the EBIDTA margins. For example, a 5% hardening of rupee against USD, will straight away knock off EBIDTA margins of exports/ USD earnings by 5%. This may or may not happen.

3.    A 0.25% increase in interest rates by Fed this year and expected four straight increases in 2018 might lead to a stagnation in the housing sector of the US due to increase in the EMIs (lower disposable income) and in the industrial/ commercial sector due to increased cost of capital, higher payback periods of projects, lower borrowing capacity due to fall in interest coverage ratios, lower capital expenditure by corporates, etc.

A third increase of 0.25% during 2017 is on the cards in the current quarter and the Fed has already indicated unwinding of the balance sheet (shedding off its assets) in a planned and predictable manner starting October 2017.

The Tax reforms passed by the Trump administration, as seen by the performance of the indices, have failed to enthuse the markets.

The next meeting of Fed is scheduled for December 12-13, next week. It will be interesting to see what direction do US and other global indices take post conclusion of the meetings and announcement of the policy decisions by Fed (announcement of the expected interest rate hike).
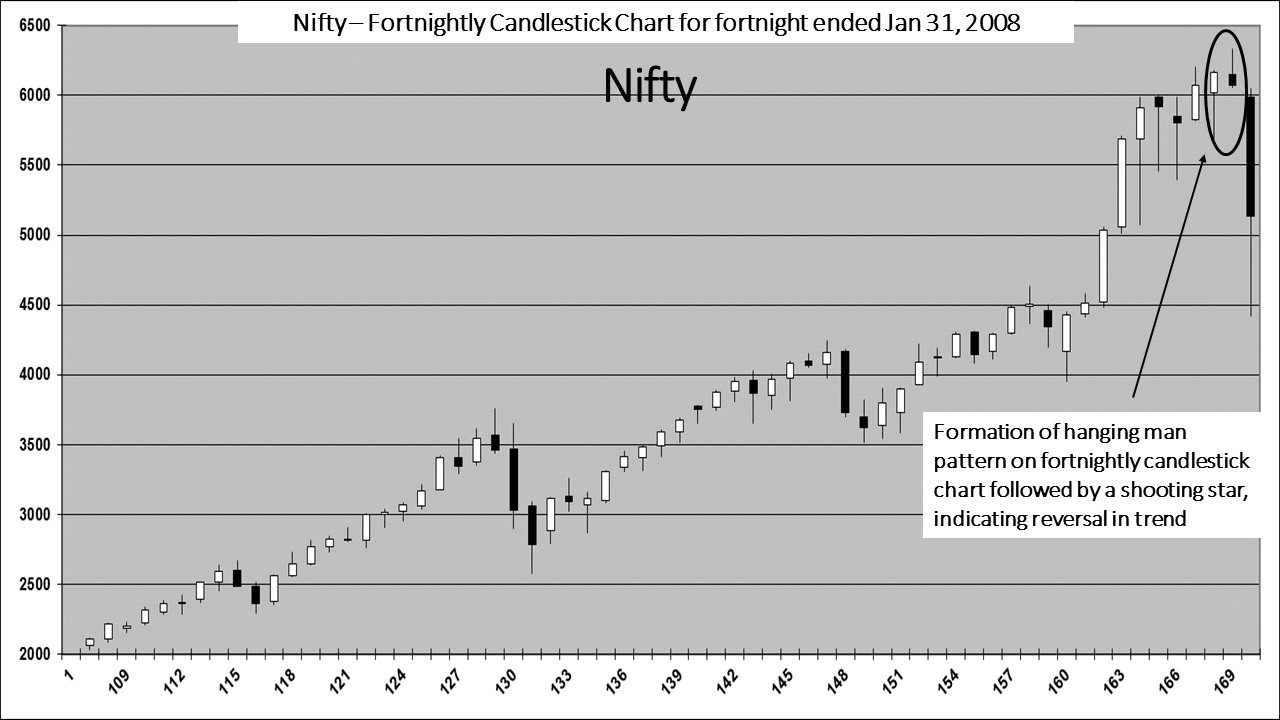
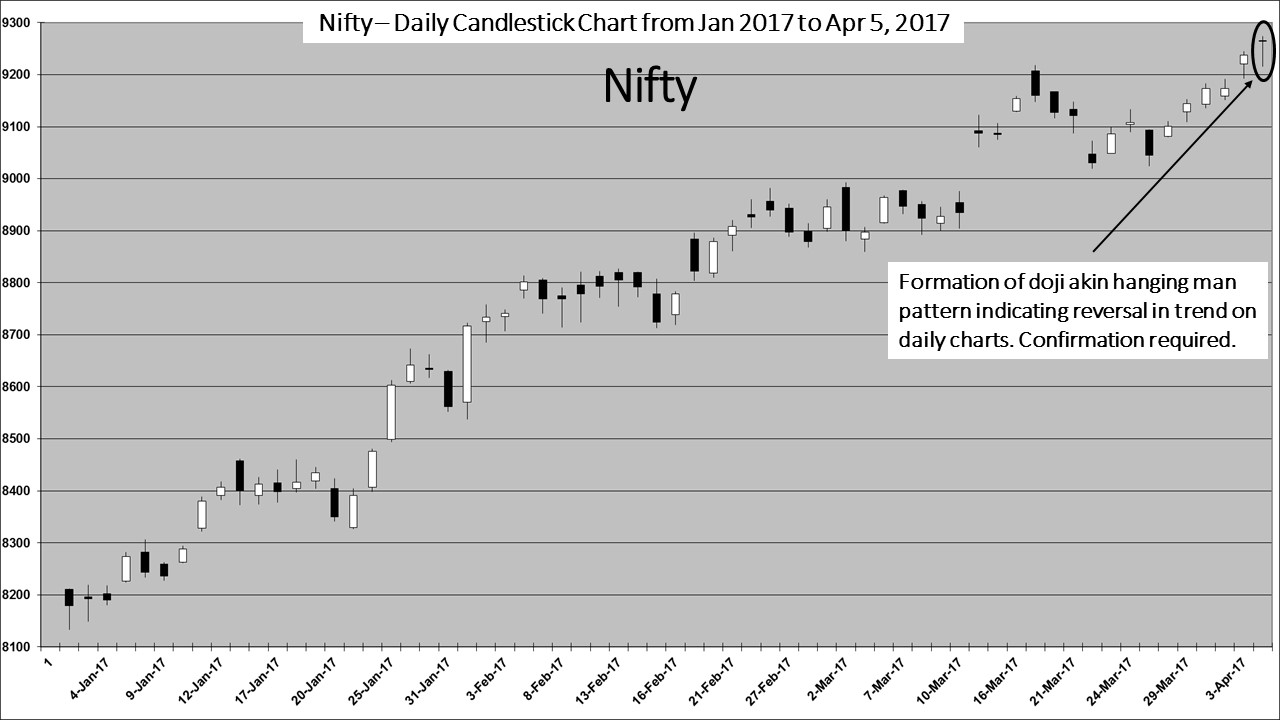
Two different variants of NIFTY multi-period candlestick charts have been given below for the readers to take clue from.


For the two multi-period candlestick charts (two monthly) shown above, there is one which coincides with calendar months and the other one which doesn’t. Both the charts indicate bearishness. The last candle on the chart where the multi-period candle coincides with the calendar months gives enough indications of bearishness of Nifty. If NIFTY goes down, it confirms bearishness. If it bounces back and goes back to the opening point or above that, it forms a hanging-man pattern, which is again a bearish indicator.

Best wishes to the readers for the festive season and New Year.

The author can be contacted at: riskadvisory@outlook.com.


DISCLAIMER:


These extracts from my trading files are for the purpose of education only. Any advice contained therein is provided for the general information of readers and does not have regard to any particular person's investment objectives, financial situation or needs and must not be construed as an advice to buy, hold and sell or otherwise deal in commodities, currencies, indices, securities or other forms of investments. Accordingly, no reader should act on the basis of any information contained therein without consulting a suitably qualified financial advisor in the first place.

Sunday 2 July 2017

NASDAQ 100

Nasdaq 100

Recent reports that the sale of flagship products of Apple Inc. has slowed down led to a selloff in the Apple stock in the beginning of June last month. This also had a rub off effect on other stocks bearing a heavy weightage in the index, consequently leading to a drop in the index as well.

Together Apple, Microsoft, Amazon, Google (Class C Stock, however the charts show Class A Stock) and Facebook contribute to 33% weightage in the Index – Nasdaq 100. Apple’s stock individually is the single largest contributor to the Index; it’s weight being close to 15%, immediately followed by Microsoft (weight 7.4%).

With the earnings season kicking in, it will be interesting to observe if the growth in earnings of these stocks has been consistent with their respective prevailing PE multiples.

However recent stock price action of the above five stocks has clearly indicated weakness and the selling pressure is evident through the pattern of the multi-period candlestick charts of these stocks.


The author can be contacted at: riskadvisory@outlook.com.

DISCLAIMER:

These extracts from my trading files are for the purpose of education only. Any advice contained therein is provided for the general information of readers and does not have regard to any particular person's investment objectives, financial situation or needs and must not be construed as an advice to buy, hold and sell or otherwise deal in commodities, currencies, indices, securities or other forms of investments. Accordingly, no reader should act on the basis of any information contained therein without consulting a suitably qualified financial advisor in the first place.

Sunday 30 April 2017

Dow Makes a Doji

Dow Makes a Doji

With the US ‘armada’ and nuclear powered USS Carl Vinson stationed at South Korea, the message to North Korea is loud and clear: “Don’t mess up with USA”.

North Korea has so far very recently had two failed missile tests. Was it an act of sabotage or the result of the US deployed THAAD (Terminal High Altitude Area Defence) System in South Korea that disabled the missiles at the launch stage itself?

With the presence of the fleet of US Navy in the peninsular region, quietening of North Korea, who has been testing missiles and conducting nuclear tests for past two decades and who has been openly challenging its neighbours including USA and Japan, will lead to a tacit acceptance of intimidation, but the fact that two missile tests were conducted (whether successful or failed) despite the repeated warnings from the US indicates that North Korea goes undeterred.

US in turn has imposed sanctions and has asked its allies to cooperate.

My concern is that if these two missile tests would have been successful, what would have been the results. Would it have provoked the US naval fleet to intercept? Could this have led to a conflict and a subsequent war?

Meanwhile there have been reports and news about the mystic named Horacio Villegas who has prophesied about breaking of nuclear war on May 13, 2017. This prophecy is dated April 17, 2017.

On the front of the financial markets, all stock indices have made higher highs during the last week totally defying and going undeterred by the abovementioned geopolitical developments. None of the indices except Dow has made any candlestick pattern indicating bearishness, though all the technical indicators have shown divergence, indicating bearishness.

There have also been reports that Nifty is going to touch/ cross 10000 by December and that is just 7% away from the current level. Interesting enough!

Given below is the two monthly candlestick chart of Dow which has made a Doji in the form similar to a ‘Hanging Man.’ A Doji or a Hanging Man (slightly different from a Doji because it has a real body which is atleast half the size of its lower shadow) is formed at the top of the market. These patterns indicate trend reversal. While a confirmation is required on the candlestick charts to confirm bearishness, this time around a confirmation will perhaps be too expensive for the stock markets.


On the other hand, despite whatever the US influential bigwigs of the financial markets may have indicated about bullion, gold and silver are geared up for a long term bull run.

The author can be contacted at: riskadvisory@outlook.com.


DISCLAIMER:

These extracts from my trading files are for the purpose of education only. Any advice contained therein is provided for the general information of readers and does not have regard to any particular person's investment objectives, financial situation or needs and must not be construed as an advice to buy, hold and sell or otherwise deal in commodities, currencies, indices, securities or other forms of investments. Accordingly, no reader should act on the basis of any information contained therein without consulting a suitably qualified financial advisor in the first place.

Sunday 16 April 2017

NIFTY Update

An Update on Nifty

Since my last post on Nifty on April 5, 2017, a few significant geopolitical events have taken place, viz., the US unilateral attack on the Syria on April 6, 2017, dropping of the largest non-nuclear bomb on hideouts of ISIS in Afghanistan on April 13, 2017 and deployment of US strategic assets (anti-missile systems in South Korea) and Air Force and Military troops near the borders of North Korea under the guise of military drills/ exercises with the real intention to counter any missile launch/ attack by the North Korean regime.

Media reports say that a failed missile launch on April 16, 2017 diffused the existing tension. Can we conclude that a missile launch could have led to the break-out of a war or it could have caused a conflict in the region?

In March 2014, at the time when Malaysian MH-370 went missing in the South China Sea, Russia had annexed Crimea and in September 2014 the self-declared republics of Donetsk and Lugansk were being supported allegedly by Russia. However it was interesting to note that the vanished MH-370 hogged the media limelight for a very long period of time and the news of usurping of Crimea by Russia largely got under reported.

Was this under reporting deliberate? Was it because of control of media by the US administration? Is the media being controlled by the US administration directly or indirectly?

Is the missile launch by the North Korean regime more prominent at the present moment in comparison to previous years (North Korea has been launching missiles since many years)? Have the tensions in the South Asian region heightened now within a week’s time or these existed even earlier and had gone unnoticed or not felt by the media?

Is the media deliberately reporting now about a war like situation or creating a situation which is harbinger to a war?

To me the present situation pertaining to North Korea looks more like a James Bond movie or a sequel of Mission Impossible with the theme music playing in the backdrop trying to create sound effects to make the viewers of the movie sit on the edge while Mr. Bond or Mr. Hunt performs feats which perhaps even a Navy Seal may not be able to perform in real life. At the end of the movie everyone is happy with the entertainment without any real life violence.

To me it will always be a puzzle as to how the financial markets are able to time the events?

Here below are two strikingly similar fortnightly candlestick charts of Nifty indicating bearishness.


The author can be contacted at: riskadvisory@outlook.com

DISCLAIMER:

These extracts from my trading files are for the purpose of education only. Any advice contained therein is provided for the general information of readers and does not have regard to any particular person's investment objectives, financial situation or needs and must not be construed as an advice to buy, hold and sell or otherwise deal in commodities, currencies, indices, securities or other forms of investments. Accordingly, no reader should act on the basis of any information contained therein without consulting a suitably qualified financial advisor in the first place. 

Wednesday 5 April 2017

NIFTY

NIFTY and BJP

Last month saw the euphoric rise of the BJP and Nifty emanating from a historic win of BJP in the Uttar Pradesh state elections thereby strengthening the party in the Upper House of the Parliament and whereby ensuring easier passage of bills henceforth.

The BJP win also negated the opinions of quite a few political pundits about the impact of demonetisation on the popularity of the Indian premier. Rather in extrapolation, the popularity increased from strength to strength, to the extent that the win has quietened quite a few quarters.

The correlation of the cause and effect relationship of the win, the demonetisation, the rise of BJP and the rise of Nifty can however not be established in the same manner as no one can ever establish the nexus between the political brass, media and the markets worldwide.

Nifty Charts

Nifty on fortnightly candlestick charts has formed a hanging man pattern which needs confirmation on fortnightly candlestick charts in the current fortnight to prove to be bearish.

Nifty on daily candlestick charts has made a doji with a long shadow/ tail akin to a hanging man pattern. This needs confirmation on daily candlestick charts to prove to be bearish.


The author can be contacted at: riskadvisory@outlook.com

DISCLAIMER:

These extracts from my trading books are for educational purposes only. Any advice contained therein is provided for the general information of readers and does not have regard to any particular person's investment objectives, financial situation or needs and must not be construed as advice to buy, hold and sell or otherwise deal in any kind of commodities, currencies, securities or other investments. Accordingly, no reader should act on the basis of any information contained therein without first having consulted a suitably qualified financial advisor.

Thursday 2 March 2017

Unfair Value of Rupee

Unfair Value of Rupee?

I came across this interesting article on Bloomberg about the fair value of rupee. While the article mentions that the Reserve Bank of India (RBI) and International Monetary Fund (IMF) believe that the rupee is overvalued or the recent gains of rupee are overstated, the State’s Ministry of Finance has worked out a separate gauge to measure rupees performance.

While RBI’s gauge measures it to be 16% overvalued, a gauge compile by BIS says it’s fairly valued.

Here is the link to the article:

While experts from various banks and currency trading outfits have opined about their view and perspective on rupee’s overvaluation, I am left a bit perplexed on two counts:

a)    Is Indian Rupee really overvalued?
b)   Is this article released deliberately at a time to open a fruitless discussion, when the rupee has suddenly crossed the bridge (please see the chart to understand what I wish to indicate)
c)    Is there some big operator unwinding long positions?

While during the next couple of days, it is premature to say what direction rupee is bound to take, the odds are definitely tilted towards gains for the rupee, in the immediate future – say a month onwards or so – for the US Dollar has fallen below the lower band of the squeeze formed as shown in the chart below. Losses in rupee value, if they occur, will be minimal and will be capped, despite the fact that there are heavy odds in favour of the FED rates going up by a quarter percentage point during its meeting to be held on 14-15th March 2017.


The readers of this article are also recommended to refer to my previous articles on the same subject, the links of which are given below:

“What is going to happen to USD after this?” dated September 11, 2015

“USD all set to rock the Currencies and other Financial Markets” dated September 19, 2016

My study is based primarily on USDINR and my study most of the times leaves me with this question, “Is Rupee really under the control of RBI?”

The author can be contacted at: riskadvisory@outlook.com

DISCLAIMER:


These extracts from my trading books are for educational purposes only. Any advice contained therein is provided for the general information of readers and does not have regard to any particular person's investment objectives, financial situation or needs and must not be construed as advice to buy, hold and sell or otherwise deal in any kind of commodities, currencies, securities or other investments. Accordingly, no reader should act on the basis of any information contained therein without first having consulted a suitably qualified financial advisor.