Sunday 10 November 2019

Fresh bull phase or signs of bearishness?

Fresh bull phase or signs of bearishness?

A quick synopsis of key events which have occurred during last 5 months summarised not necessarily in the chronological order or order of importance:

Interest Rates and QE

ECB sets the rate on deposits to -0.50% and announces QE starting this month (November 2019)

Fed reduces interest rates by a quarter percentage point and announces a pause on rate reduction in the near term.

Geo-political tensions and disruption in the global oil supplies

A variety of geo-political events happened related to Saudi Arabia, Turkey, Kurds, Syria and Iran and consequent tensions may continue in the future.

There was a drone attack on the oil facilities of Saudi Aramco which disrupted a significant percentage of global supplies but the supplies were restored in a short span of time.

North Korea resumed conducting its ballistic missile tests.

Tweets, Trade War, Tariffs

Premiers of two large economies of the world got engaged in an exchange of tweets leading to a high volatility in the global financial markets. Twitter should be grateful to these premiers for using its platform that drew lot of fan following of these Premiers.

Series of tweets and continuing trade war by way of tariffs and consequent attempt to reach an agreement by the premiers of these countries is akin to seamless streaming of the movie ‘Now You See Him Now You Don’t’ or Mr. India, the desi version, leading global financial markets on the edge.

Inverted Yields

The yields on American bonds got inverted.

Brexit

Brexit has so far seen exit of two British Prime Ministers instead of exit of Britain out of Euro Zone. The third Prime Minister attempting Brexit has adopted some unconventional means for the legislation of Brexit to go through, including holding fresh elections in December in the hope of garnering more votes for the passage of bill and meanwhile the Brexit date has been extended by the EU to January 31, 2020 upon request of the British PM.

Considering that the global indices and stock markets remained unfazed by all the above global uncertainties and moved unidirectional in the overbought zone, despite minor hiccups, it is becoming increasingly difficult to ascertain as to what factors could keep the indices scaling higher or what factors could be the possible trigger/s for the bearishness of the global stock markets in the wake of bearish signs getting developed on charts, besides visible signs of global slowdown in jobs, economic, housing and GDP data.

Since the markets are continuing to scale fresh highs or are being extremely close to the recently made highs in the preceding two quarters, many financial pundits, business channel editors and anchors advocating the ‘Buy on dips’ mantra, Chairpersons/ Managing Directors of large banks/ Housing Finance companies, big bull investors and many others have started predicting the emergence of a fresh bull phase.

However in light of the following charts, this unanimous optimism, remains a matter of discomfort:

Both Dow Jones and Nifty have formed two ‘Hanging Man’ candlestick patterns on quarterly charts (bearish signs). The third quarterly chart which is under completion (will get completed by December end) on both the indices is also in the form of a hanging man (please see the quarterly candlestick charts of both Dow as well as Nifty elsewhere in this post below).

Nifty

While September Quarter hanging man has given bearish confirmation (the dark real body of the September quarter  candle covers the white real body of the preceding quarterly candle, i.e., June Quarter hanging man), the current quarter (December quarter – under completion) candle is also so far in the form of a white hanging man.

However in this case there are two observations. The index (Nifty) has not been able to cross highs of previous quarter despite announcement of a slew of stimulus measures and there are close to a little short of two months left for the quarterly candle to be complete before a conclusion can be drawn.


Meanwhile, Moody’s has downgraded India’s rating from “Stable” to “Negative.”

A day prior to the announcement of rating downgrade, Nifty formed a hanging man on the daily candlestick charts and it was followed by a drop in the index after announcement.


On weekly candlestick charts, Nifty has formed a shooting star candlestick/ doji.


Dow

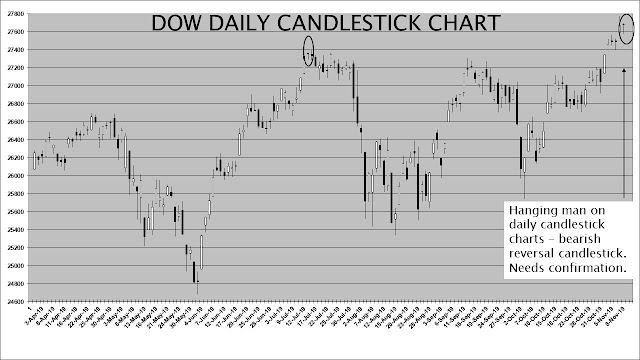
In case of Dow, the three quarterly hanging man candles (third one under completion), have scaled new highs one after another.


On the last occasion, there is a formation of a hanging man on daily candlestick charts as was formed on Nifty in the second last trading session.


Excitement in the local stock markets

On home turf, a slew of measures providing intermediate and long-term financial stimulus to the economy were announced by the Finance Minister on two different occasions by way of review/ roll back of 2019-20 Central Budget provisions and Income Tax rate cuts, bringing India at par with its South East Asian peers, with the intent of attracting and inviting long term foreign capital. Combined cost of these two stimulus measures is close to or exceeds Rs.2 trillion.

With the foregoing commentary, I leave the readers to conclude for themselves the direction that the markets are going to take.

Best wishes for the festive season.


For more charts the author can be contacted at: riskadvisory@outlook.com.

DISCLAIMER:

These extracts from my trading worksheets/books are for the purpose of education only. Any advice contained therein is provided for the general information of readers and does not have regard to any particular person's investment objectives, financial situation or needs and must not be construed as an advice to buy, hold and sell or otherwise deal/ trade in commodities, currencies, indices, securities or other forms of investments. Accordingly, no reader should act on the basis of any information contained therein without consulting a suitably qualified financial advisor in the first place.

Sunday 2 June 2019

The Sino-US Trade War and Onset of Interest Rate cuts

The Sino-US Trade War – Where will it lead to?

What started as a showcase of cheap cost manufacturing base by China, luring the transnational companies to set up global scale manufacturing bases in China for mass production to suit every nation’s consumption requirements, in the decades of 1990, 2000 and 2010, with the help of huge FDIs coming in from the world’s largest economy, turned out to be a dragon trying to overshadow, outgrow and giving tough competition to the largest economy of the world, i.e., the US.

If we make an attempt to analyse and compare the two economies, i.e., the US and the Chinese, the US has an exceptionally strong currency, which helps boost consumption of imported goods, a strong ecosystem encouraging R&D, innovation and attracting talent pool from across the globe, a capitalist set up, which encourages entrepreneurship, as its key strong points amongst many others.

Contrasting that is the Chinese economy with a formidable unparalleled manufacturing base (not easily replicable by a competing country in a short span of time), a huge population to boost domestic consumption and a wide client base (countries to which China exports), a world class infrastructure which challenges that of the US, a communist government with intent and designs of territorial expansions (merely by claims and deployment of force), control over the natural resources and key strategic locations of the South East Asian nations.

With the gap between the incremental GDP of the two countries narrowing down fast; China becoming an increasingly superior technological and cyber power and a clutch of Chinese companies supplying future generation telecom equipment and mobile handsets globally with espionage capabilities; China building OBOR, threatening the sovereignty of the countries of the Indian subcontinent; having dominant presence of its naval fleet in the Indian Ocean/ South China Sea, challenging and threatening geopolitical stability in these regions, it becomes imperative for the US to curb the dominance of China or the Chinese companies actively engaged in such activities and take measures that put a check on China’s economic and cyber prowess and also its territorial expansionary tendencies. The US thinks so.

The trade war which was initiated by the US in Jan 2018 primarily against China has not seen any signs of abatement, rather on the contrary has only been exacerbated by the warring nations. The hubris of the nations to prove dominance or not to show any signs of weakness has led the two nations to go ahead with firing the ammunition in their respective arsenals with no signs or intentions by either one to blink first.

The trade war proxy seems to be the most visible sign of ego of the two nations without leading them anywhere in achieving their visible or ulterior motives. Perhaps this was the only form of war that could have been engaged in. The two nations are engaged in causing self-inflicting wounds, with the intention to hurt the other.

The latest salvo fired by the Chinese Premier is the hint of restricting/ suspending the exports of rare earth metals to USA, which find applications in US defence industry and wide range of economic activities. China has 40% of the world reserves and contributes to 70% of the global production. USA sources 80% of its rare earth metals requirement from China.

It is a widely accepted norm that China doesn’t throw a hint without a follow-up action. This indicates that it will take some time before USA could be able to meet its total requirements from sources other than China.

For a few dollars more

Microsoft is now the most valuable company of the world with the distinction of entering the trillion dollar club for just a day and giving company to Apple and Amazon. The share price of the company kept hovering just a few dollars below the rate (approx. US$ 130.5/ share) where it entered the trillion dollar mark market cap just for a day but still continues to be the most valuable company since then, ahead of Apple and Amazon.

A tribute to a karma Yogi of India

This post would not be complete without a tribute to Yogi Deveshwar, Padma Bhushan, whom India lost in the din and cacophony during the recently concluded elections in India. A true karma Yogi, he took helm of the operations of ITC in 1996 and transformed its image from being a tobacco company to that of multinational conglomerate with a strong flavour of FMCG. Yogi was the longest serving CEO of any Indian company till the time of his departure. Yogi also held many other coveted posts in various other institutions.

The company’s e-Choupal initiative finds its mention in the bestselling book, “Fortune at the Bottom of the Pyramid,” authored by Strategy Guru, C K Prahlad.

Despite the churn which keeps happening in the list of India’s most valuable companies, ITC consistently appeared in the list of top 10 companies for decades under Yogi’s able leadership.

RIP Yogi.

US Fed interest rates

In the recently released minutes of the last held Federal Reserve policy meet, the Fed has pledged continued patience and commitment to stable rates/ no rates hike regime. Fed has on many occasions given reasonable indications of easing monetary policy in future in case the US economy faces head winds.

RBI’s upcoming monetary policy announcement in first week of June 2019

With a stable government in place and visible signs of a global slowdown it is a widely formed opinion that the RBI is expected to announce a rate cut in the forthcoming policy meeting in the first week of June.

Nifty, Indices and Stocks

In light of the formation of a stable government at the centre, by a party with an absolute majority, many financial analysts are of the opinion that Nifty may see and upside of 10-15% from the current levels in the immediate future. While the long term trend of growth of the Indian economy remains intact, the following charts indicate a near term correction in Nifty.

Also given are the charts of a few other indices and stocks which indicate that the ensuing correction is expected to be a global phenomenon not linked to a particular region, country or event.

NIFTY


DOW

NASDAQ 100


APPLE


AMAZON


MICROSOFT


But the question that I keep asking myself and which remains unaddressed in my mind is this: “If the Sino-US trade war comes to an abrupt end, will the global indices scale back to their previous highs and not correct further?”

For more charts the author can be contacted at: riskadvisory@outlook.com.


DISCLAIMER:

These extracts from my trading worksheets/books are for the purpose of education only. Any advice contained therein is provided for the general information of readers and does not have regard to any particular person's investment objectives, financial situation or needs and must not be construed as an advice to buy, hold and sell or otherwise deal/ trade in commodities, currencies, indices, securities or other forms of investments. Accordingly, no reader should act on the basis of any information contained therein without consulting a suitably qualified financial advisor in the first place.

Wednesday 6 February 2019

The Great Walls of Mexico and China & Other Updates


The Great Walls of Mexico and China

US government shutdown

The US Government shutdown resulted from the non-passage of the bill to fund the building of the wall along the Mexican border to fulfil pre-election promise by president Trump. While the demand for the funds for building the wall was US$ 5.7 billion, the estimated cost of the US shutdown has been $11 billion so far.

Readers interested in further details may read the article through the link given below: https://en.wikipedia.org/wiki/2018%E2%80%9319_United_States_federal_government_shutdown

According to some official estimates, a government shutdown shaves off 0.1% from the GDP every two weeks.

Tariff war between USA and China

The trade tariffs imposed by the US on China have invited a similar counter action from the Chinese authorities. The impact of tariffs on an exporting country can theoretically be neutralised by devaluation of the currency of the exporting country, however, imposing tariffs on the imports of goods from the US by China is a more effective retaliatory counter measure.

A slowdown in China is evident, as seen from the released Chinese trade data. Whether this slowdown has resulted from the slower exports to the US due to imposition of tariffs or a slowdown in the US consumption is something that cannot be conclusively inferred, despite whatever may get reported by the media.

US Fed interest rates

In the recently concluded Federal Reserve policy meet, the chairperson Jerome Powell announced Fed’s patience in hiking interest rates, considering the general slowdown in USA. The interest rates remain untouched in the 2.25% to 2.50% range.

ECB Monetary Policy

In the meeting of the European Central Bankers held on January 24, 2019, president Draghi announced no hike of interest rates until mid-2020, thereby inviting concerns about the growth of the Eurozone. He however skilfully set to rest the concerns by justifying the policy decision by citing events such as trade war between USA and China, Brexit and certain pockets of Eurozone experiencing slowdown rather than being influenced by any other major internal economic event of significant consequence.

Union Budget 2019-20

On the home turf, pre-budget debates amongst the economic pundits and media personnel predominantly revolved around two key concerns, viz., budget deficit exceeding the target of 3.3% as well as failure to stick to disinvestment targets of the PSUs.

However, post budget, the budget was unanimously hailed by global pundits and Indian industry veterans as growth and consumption oriented with inclusion of farm, animal husbandry, rural and real estate sectors as well as the burgeoning middle class and entry level salaried workforce to be the anticipated engines and drivers of growth in the future.

RBI’s upcoming monetary announcement on February 7

Considering stable interest rate policies of Fed and ECB, it is unlikely that RBI will tamper with the interest rates, despite benign food and fuel inflation.

Other Updates

World Indices
Despite intermediate upswings, the global stock indices as mentioned in my previous post dated October 18, 2018, continue to remain in primary downtrend.

The world stock indices (US and Indian) have an extremely low probability of a bounce back above the previously attained levels.

Crude Oil (WTI) and USDINR

After touching sub $50 per barrel levels, WTI crude oil may rise and find resistance at two levels, viz., $59-60 and subsequently in the $69-70 zone in the near term (3-4 months) and may subsequently drift sideways to downwards from there. Consequently, USDINR is likely to retest the levels of Rs.74.00-74.50/USD within next few months and the INR will get stronger subsequently.

Apple and Amazon

Apple and Amazon are two legendry stocks to have touched the USD 1 trillion mark, for a very brief duration and intra-day, respectively and which then subsequently fell flat.

A rock solid stock/ institution like Apple, renowned for its marquee flagship product iPhone (a dream product of the masses), which saw some of the most respectable companies, their divisions or a few of their products in global leadership positions, go belly up, almost a decade back (since its launch in 2007), itself got challenged by a clutch of small Chinese rivals on accounts of pricing, features and aesthetics, proving the versatility and superiority of open source (android) over iOS, leading to a drop in the number of shipments of Apple products across the world and a consequent drop in its share price, eroding almost 30% of its shareholders' wealth from the peak achieved.

Apple’s recent public statement, “There is life beyond iPhone,” needs to be proven by the company in the near term.

Given below is the three monthly candlestick chart of Apple indicating the dent that the stock has received in its market price.


Amazon and Bitcoin

Given below are three candlestick charts:
1.    The first two charts show comparison between Amazon’s quarterly candlestick chart and Bitcoin’s weekly candlestick chart.
2.    The third chart is the weekly candlestick chart of Bitcoin, till date, post-crash.


While it will not be prudent to infer any conclusions because there is no sure shot pattern as to how a stock may behave, such a comparison as above can perhaps give some reference as to how momentum stocks and some speculative charts behave (Bitcoin has no underlying assets).

A recent quarter page news in a local business newspaper gives reference of non-triggering of anti-trust provisions against Amazon based on accumulated losses and because of a dominant complex structure which leads to co-opting of rivals rather than driving them away.

This serves as food for thought for the Indian authorities as well so as to consider redefining a dominant enterprise not just on the basis of share of profits or market share in the industry but by introduction of newer criteria, a few of which amongst many could possibly be, the size of assets, enterprise value, ability to raise Super Uber capital or a few others which can stifle competition under the garb of long term view/ investment, value/ beneficial for customers etc.

The next wave of fall in the US indices may be led by Apple and Amazon duo, which have a very high weightage in the index – Nasdaq 100.

Best wishes for the New Year, albeit a bit delayed.

For more charts the author can be contacted at: riskadvisory@outlook.com.


DISCLAIMER:

These extracts from my trading worksheets/books are for the purpose of education only. Any advice contained therein is provided for the general information of readers and does not have regard to any particular person's investment objectives, financial situation or needs and must not be construed as an advice to buy, hold and sell or otherwise deal/ trade in commodities, currencies, indices, securities or other forms of investments. Accordingly, no reader should act on the basis of any information contained therein without consulting a suitably qualified financial advisor in the first place.