Crude Oil – WTI (INR and USD)
Talks are
abuzz that Crude Oil is going to fall further. There is news that there may be far
excess supply in 2016 than what the global markets may be able to absorb and
that the crude carrying ships are being used as storage capacities and crude is
being ferried to the farthest destinations so as to increase the transit time
for very well-known reasons.
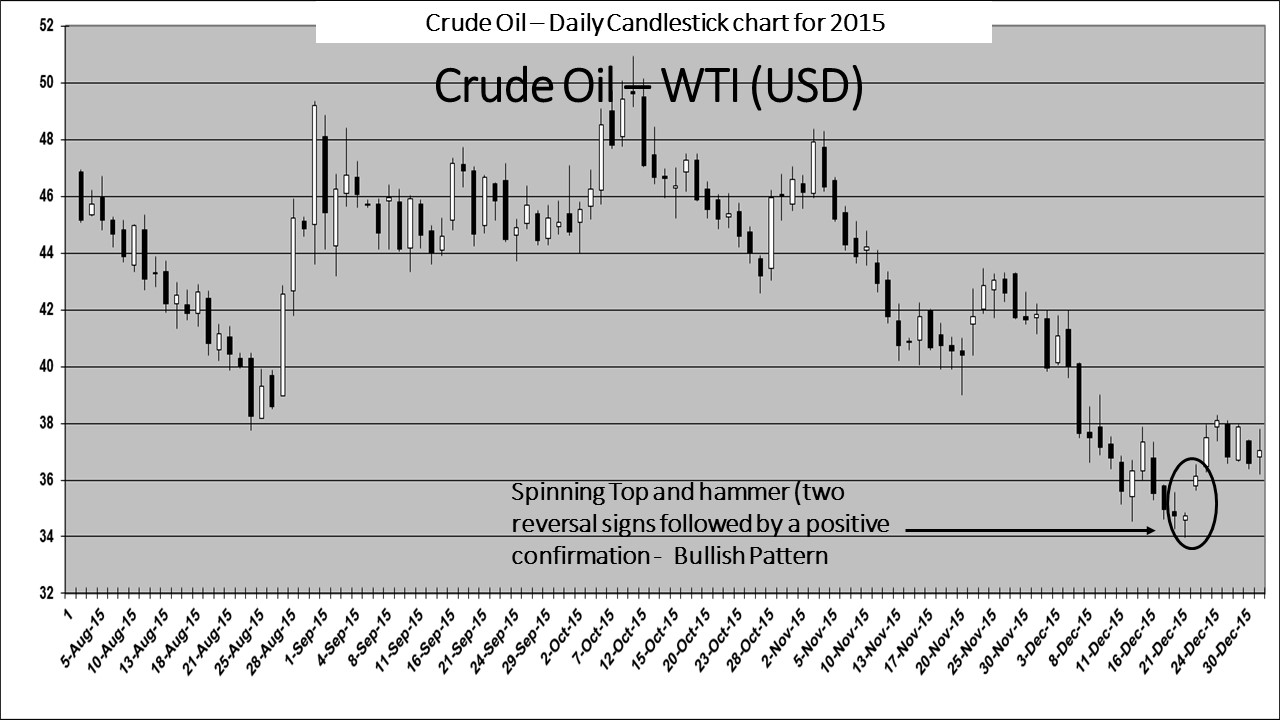
However the
most recent candlestick chart patterns of WTI (INR and USD) have thrown up some
surprises. While a few of them have been followed by positive confirmations, a
positive confirmation is yet to follow on fortnightly and monthly candlestick
charts (INR and USD).
The adapted Bollinger
Bands do not yet give any indication of formation of a squeeze and a consequent
reversal of trend, yet it seems after combining all the above factors that
Crude Oil is in a consolidative phase and at least for now the rates have stabilised.
A bullish
phase would be confirmed with the formation of a white candle on the monthly
candlestick charts and with the initiation of the formation of a squeeze on
adapted Bollinger Bands.


Best wishes for the New Year 2016.
Contact:
The author can be contacted at: riskadvisory@outlook.com.
Disclaimer:
These extracts from my trading books are for educational purposes only. Any
advice contained therein is provided for the general information of readers and
does not have regard to any particular person's investment objectives,
financial situation or needs and must not be construed as advice to buy, sell,
hold or otherwise deal with any commodities, currencies, securities or other
investments. Accordingly, no reader should act on the basis of any information
contained therein without first having consulted a suitably qualified financial
advisor.